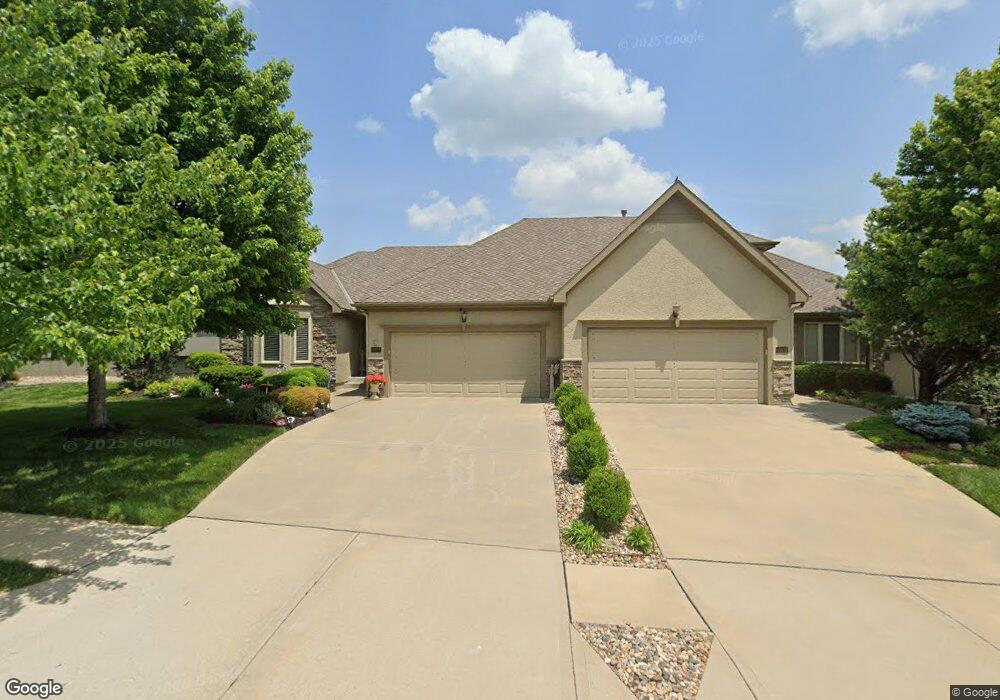
19516 W 100th Terrace Lenexa, KS 66220
Estimated Value: $458,908 - $517,000
3
Beds
3
Baths
1,952
Sq Ft
$255/Sq Ft
Est. Value
About This Home
This home is located at 19516 W 100th Terrace, Lenexa, KS 66220 and is currently estimated at $497,977, approximately $255 per square foot. 19516 W 100th Terrace is a home located in Johnson County with nearby schools including Manchester Park Elementary School, Prairie Trail Middle School, and Olathe Northwest High School.
Ownership History
Date
Name
Owned For
Owner Type
Purchase Details
Closed on
Jul 28, 2009
Sold by
Falcon Valley Llc
Bought by
Rome Patricia M
Current Estimated Value
Home Financials for this Owner
Home Financials are based on the most recent Mortgage that was taken out on this home.
Original Mortgage
$203,200
Outstanding Balance
$134,033
Interest Rate
5.44%
Mortgage Type
Purchase Money Mortgage
Estimated Equity
$363,944
Purchase Details
Closed on
Feb 12, 2009
Sold by
Kja Construction Llc
Bought by
Falcon Valley Llc
Purchase Details
Closed on
Jan 29, 2009
Sold by
Craig Owsley Builders Llc
Bought by
Kja Construction Llc
Purchase Details
Closed on
Mar 22, 2006
Sold by
Falcon Valley Llc
Bought by
Craig Owlsey Builders Llc
Create a Home Valuation Report for This Property
The Home Valuation Report is an in-depth analysis detailing your home's value as well as a comparison with similar homes in the area
Home Values in the Area
Average Home Value in this Area
Purchase History
| Date | Buyer | Sale Price | Title Company |
|---|---|---|---|
| Rome Patricia M | -- | Kansas City Title | |
| Falcon Valley Llc | -- | Kansas City Title | |
| Kja Construction Llc | -- | None Available | |
| Craig Owlsey Builders Llc | -- | Kansas City Title |
Source: Public Records
Mortgage History
| Date | Status | Borrower | Loan Amount |
|---|---|---|---|
| Open | Rome Patricia M | $203,200 |
Source: Public Records
Tax History Compared to Growth
Tax History
| Year | Tax Paid | Tax Assessment Tax Assessment Total Assessment is a certain percentage of the fair market value that is determined by local assessors to be the total taxable value of land and additions on the property. | Land | Improvement |
|---|---|---|---|---|
| 2024 | $5,482 | $44,735 | $6,415 | $38,320 |
| 2023 | $5,337 | $42,608 | $6,415 | $36,193 |
| 2022 | $5,261 | $40,952 | $4,937 | $36,015 |
| 2021 | $5,321 | $39,353 | $4,937 | $34,416 |
| 2020 | $5,071 | $37,122 | $4,937 | $32,185 |
| 2019 | $5,311 | $38,617 | $7,163 | $31,454 |
| 2018 | $4,852 | $36,018 | $7,163 | $28,855 |
| 2017 | $4,789 | $33,661 | $4,298 | $29,363 |
| 2016 | $4,733 | $34,029 | $4,093 | $29,936 |
| 2015 | $4,659 | $33,511 | $4,093 | $29,418 |
| 2013 | -- | $29,532 | $4,093 | $25,439 |
Source: Public Records
Map
Nearby Homes
- 9835 Walker St
- 19220 W 98th Terrace
- 9844 Stevenson St
- 18932 W 100th St
- 18804 W 99th St
- 9917 Fountain Cir
- 18732 W 99th St
- 18637 W 97th Terrace
- 9500 Woodland Rd
- 0 W 95th St
- 20516 W 98th Place
- 20802 W 102nd St
- 9517 Falcon Ridge Dr
- 9705 Sunset Cir
- 20035 W 107th Terrace
- 22003 W 100th Terrace
- 20914 W 96th Terrace
- 20825 W 94th Terrace
- 20457 W 107th Terrace
- 10206 Theden Cir
- 19518 W 100th Terrace
- 19510 W 100th Terrace
- 19508 W 100th Terrace
- 19520 W 100th Terrace
- 19522 W 100th Terrace
- 19513 W 100th St
- 10010 Millstone Dr
- 19515 W 100th Terrace
- 19517 W 100th Terrace
- 19509 W 100th Terrace
- 19511 W 100th Terrace
- 19515 W 100th St
- 19524 W 100th Terrace
- 19509 W 100th St
- 19507 W 100th St
- 19503 W 100th Terrace
- 19521 W 100th Terrace
- 10006 Millstone Dr
- 19501 W 100th Terrace
- 19523 W 100th Terrace