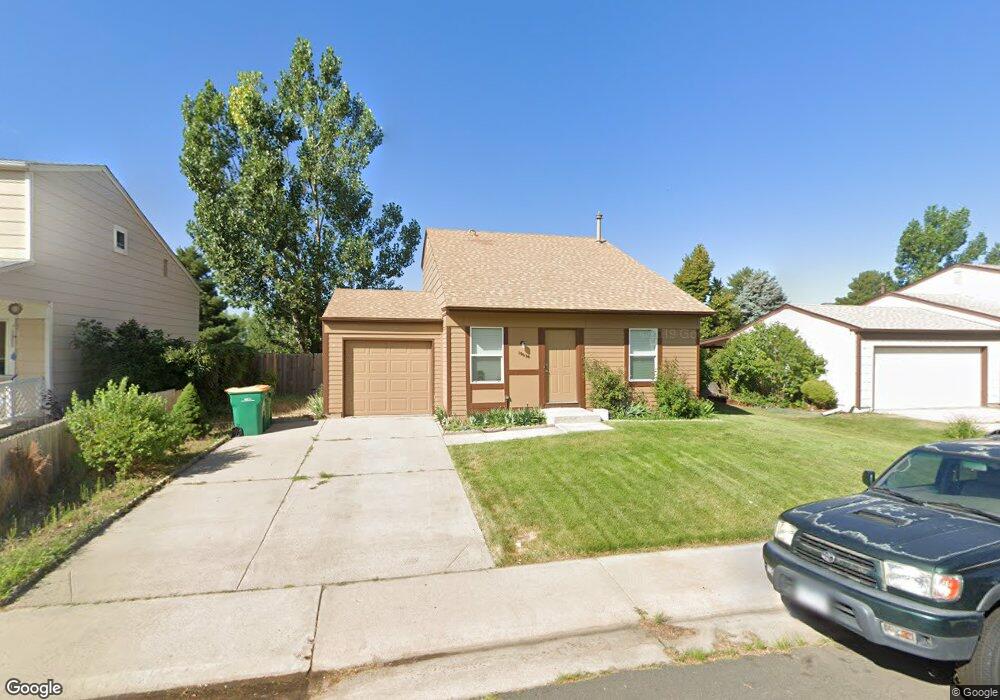
19530 E Batavia Dr Aurora, CO 80011
Tower Triangle NeighborhoodEstimated Value: $342,000 - $412,000
3
Beds
2
Baths
1,224
Sq Ft
$314/Sq Ft
Est. Value
About This Home
This home is located at 19530 E Batavia Dr, Aurora, CO 80011 and is currently estimated at $384,657, approximately $314 per square foot. 19530 E Batavia Dr is a home located in Adams County with nearby schools including Clyde Miller K-8 and Vista Peak 9-12 Preparatory.
Ownership History
Date
Name
Owned For
Owner Type
Purchase Details
Closed on
Jun 7, 2019
Sold by
2019 1H Borrower Lp
Bought by
2019 1H Borrower Lp
Current Estimated Value
Purchase Details
Closed on
Nov 3, 2016
Sold by
Inverclyde Llc
Bought by
Chs 2016 2 Borrower Llc
Purchase Details
Closed on
Jan 28, 2015
Sold by
Butler Lloyd
Bought by
Inverclyde Llc
Purchase Details
Closed on
May 31, 2007
Sold by
Mcmullin Daren Mark
Bought by
Butler Lloyd
Home Financials for this Owner
Home Financials are based on the most recent Mortgage that was taken out on this home.
Original Mortgage
$102,500
Interest Rate
6.17%
Mortgage Type
Unknown
Purchase Details
Closed on
Apr 29, 2003
Sold by
Mcmullin Daren Mark and Zabel Tonja Noreen
Bought by
Mcmullin Daren Mark
Home Financials for this Owner
Home Financials are based on the most recent Mortgage that was taken out on this home.
Original Mortgage
$101,500
Interest Rate
5.77%
Mortgage Type
FHA
Create a Home Valuation Report for This Property
The Home Valuation Report is an in-depth analysis detailing your home's value as well as a comparison with similar homes in the area
Home Values in the Area
Average Home Value in this Area
Purchase History
| Date | Buyer | Sale Price | Title Company |
|---|---|---|---|
| 2019 1H Borrower Lp | -- | Os National Llc | |
| Chs 2016 2 Borrower Llc | -- | None Available | |
| Inverclyde Llc | $155,000 | Chicago Title Co | |
| Butler Lloyd | $102,500 | Land Title | |
| Mcmullin Daren Mark | -- | -- |
Source: Public Records
Mortgage History
| Date | Status | Borrower | Loan Amount |
|---|---|---|---|
| Previous Owner | Butler Lloyd | $102,500 | |
| Previous Owner | Mcmullin Daren Mark | $101,500 |
Source: Public Records
Tax History
| Year | Tax Paid | Tax Assessment Tax Assessment Total Assessment is a certain percentage of the fair market value that is determined by local assessors to be the total taxable value of land and additions on the property. | Land | Improvement |
|---|---|---|---|---|
| 2025 | $2,512 | $25,500 | $5,640 | $19,860 |
| 2024 | $2,512 | $23,440 | $5,190 | $18,250 |
| 2023 | $2,552 | $27,670 | $5,070 | $22,600 |
| 2022 | $2,279 | $20,060 | $5,140 | $14,920 |
| 2021 | $2,375 | $20,060 | $5,140 | $14,920 |
| 2020 | $2,311 | $19,580 | $5,290 | $14,290 |
| 2019 | $2,306 | $19,580 | $5,290 | $14,290 |
| 2018 | $1,752 | $14,810 | $4,680 | $10,130 |
| 2017 | $1,556 | $14,810 | $4,680 | $10,130 |
| 2016 | $1,147 | $10,820 | $2,390 | $8,430 |
| 2015 | $1,111 | $10,820 | $2,390 | $8,430 |
| 2014 | $1,016 | $9,740 | $1,750 | $7,990 |
Source: Public Records
Map
Nearby Homes
- 19583 E Buchanan Place
- 19682 E Batavia Dr
- 1635 Ensenada Way
- 1619 Ensenada St
- 1914 Ensenada Ct
- 2039 Espana Way
- 1956 Cathay St
- 1791 Biscay St
- 1770 Bahama St
- 19093 E 22nd Dr
- 1931 Andes St
- 24091 E 30th Ave
- 24121 E 30th Ave
- 24101 E 30th Ave
- 17546 E Batavia Place
- 17553 E 17th Place Unit 98
- 17585 E 18th Place Unit 105
- 17486 E Buchanan Place
- 1889 Salida St
- 17309 E 16th Dr Unit 220
- 19540 E Batavia Dr
- 19520 E Batavia Dr
- 19550 E Batavia Dr
- 19510 E Batavia Dr
- 19531 E Batavia Dr
- 19541 E Batavia Dr
- 19521 E Batavia Dr
- 19551 E Batavia Dr
- 19560 E Batavia Dr
- 19511 E Batavia Dr
- 19500 E Batavia Dr
- 19561 E Batavia Dr
- 19532 E Buchanan Place
- 19501 E Batavia Dr
- 19542 E Buchanan Place
- 19570 E Batavia Dr
- 19522 E Buchanan Place
- 19552 E Buchanan Place
- 19512 E Buchanan Place
- 19571 E Batavia Dr
Your Personal Tour Guide
Ask me questions while you tour the home.