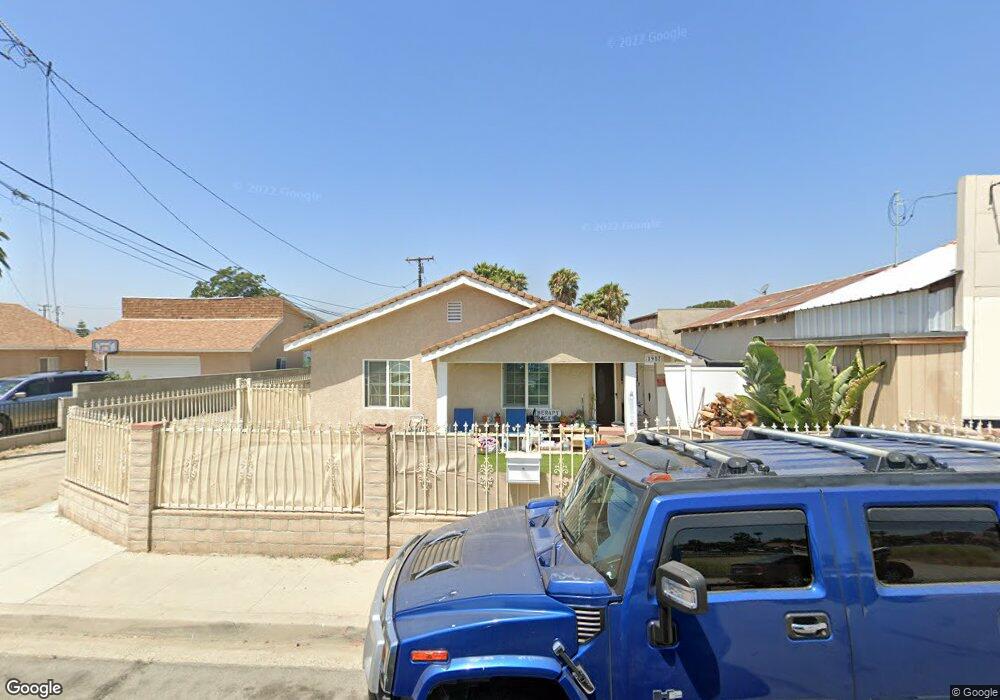
1957 3rd St Simi Valley, CA 93065
West Simi Valley NeighborhoodEstimated Value: $649,208 - $746,000
3
Beds
2
Baths
1,030
Sq Ft
$662/Sq Ft
Est. Value
About This Home
This home is located at 1957 3rd St, Simi Valley, CA 93065 and is currently estimated at $681,552, approximately $661 per square foot. 1957 3rd St is a home located in Ventura County with nearby schools including Arroyo Elementary School, Sinaloa Middle School, and Royal High School.
Ownership History
Date
Name
Owned For
Owner Type
Purchase Details
Closed on
Feb 13, 2023
Sold by
Nguyen Joycelyn Tran
Bought by
Joycelyn Tran Nguyen Living Trust
Current Estimated Value
Purchase Details
Closed on
Aug 3, 2018
Sold by
Nguyen Joakim N and Tran Lonnie
Bought by
Nguyen Joakim T and Tran Lonnie
Purchase Details
Closed on
Jul 13, 2006
Sold by
Tran Lonnie
Bought by
Nguyen Joakim T and Tran Lonnie
Purchase Details
Closed on
Sep 30, 2005
Sold by
Nguyen Joakim T
Bought by
Tran Lonnie
Purchase Details
Closed on
Sep 20, 2005
Sold by
Banaga Ruben
Bought by
Tran Lonnie
Purchase Details
Closed on
May 4, 2004
Sold by
Banaga Ramona
Bought by
Banaga Ruben
Purchase Details
Closed on
Feb 6, 1998
Sold by
Manuel Banaga and Manuel Raoul G
Bought by
Banaga Armand G
Create a Home Valuation Report for This Property
The Home Valuation Report is an in-depth analysis detailing your home's value as well as a comparison with similar homes in the area
Home Values in the Area
Average Home Value in this Area
Purchase History
| Date | Buyer | Sale Price | Title Company |
|---|---|---|---|
| Joycelyn Tran Nguyen Living Trust | -- | -- | |
| Nguyen Joycelyn Tran | -- | -- | |
| Nguyen Joakim T | $125,000 | None Available | |
| Nguyen Joakim T | -- | Gateway Title | |
| Tran Lonnie | -- | First American Title Ins Co | |
| Tran Lonnie | $200,000 | First American Title Ins Co | |
| Banaga Ruben | -- | Chicago Title Co | |
| Banaga Armand G | -- | -- |
Source: Public Records
Tax History
| Year | Tax Paid | Tax Assessment Tax Assessment Total Assessment is a certain percentage of the fair market value that is determined by local assessors to be the total taxable value of land and additions on the property. | Land | Improvement |
|---|---|---|---|---|
| 2025 | $5,355 | $431,823 | $269,211 | $162,612 |
| 2024 | $5,355 | $423,356 | $263,932 | $159,424 |
| 2023 | $5,033 | $415,055 | $258,756 | $156,299 |
| 2022 | $5,006 | $406,917 | $253,682 | $153,235 |
| 2021 | $4,963 | $398,939 | $248,708 | $150,231 |
| 2020 | $4,855 | $394,850 | $246,158 | $148,692 |
| 2019 | $4,633 | $387,109 | $241,332 | $145,777 |
| 2018 | $4,589 | $379,519 | $236,600 | $142,919 |
| 2017 | $4,483 | $372,078 | $231,961 | $140,117 |
| 2016 | $4,280 | $364,783 | $227,413 | $137,370 |
| 2015 | $4,186 | $359,305 | $223,998 | $135,307 |
| 2014 | $4,123 | $352,268 | $219,611 | $132,657 |
Source: Public Records
Map
Nearby Homes
- 1754 Sinaloa Rd Unit 271
- 1772 Sinaloa Rd Unit 189
- 1766 Sinaloa Rd Unit 177
- 1766 Sinaloa Rd Unit 282
- 938 Ventura Ave
- 1529 Paul St
- 1507 4th St
- 1246 Patricia Ave Unit 21
- 1246 Patricia Ave Unit 28
- 1256 Patricia Ave Unit 10
- 786 Royal Ave
- 1280 Patricia Ave
- 1760 Millpark Ln
- 1459 Willowbrook Ln
- 1240 Graham St
- 1335 El Monte Dr
- 459 Mark Dr
- 1743 Duskwood Way
- 1391 Patricia Ave
- 1271 Alexander St
- 1933 3rd St
- 865 California Ave
- 838 E Los Angeles Ave
- 885 California Ave
- 845 California Ave
- 1942 4th St
- 1912 4th St
- 1890 3rd St Unit RORY
- 890 California Ave
- 862 California Ave
- 914 California Ave
- 830 California Ave
- 1890 4th St Unit RORY
- 1866 3rd St Unit RORY
- 1886 4th St
- 1860 3rd St
- 1878 4th St Unit RORY
- 954 California Ave
- 1854 4th St Unit RORY
- 1885 4th St
Your Personal Tour Guide
Ask me questions while you tour the home.