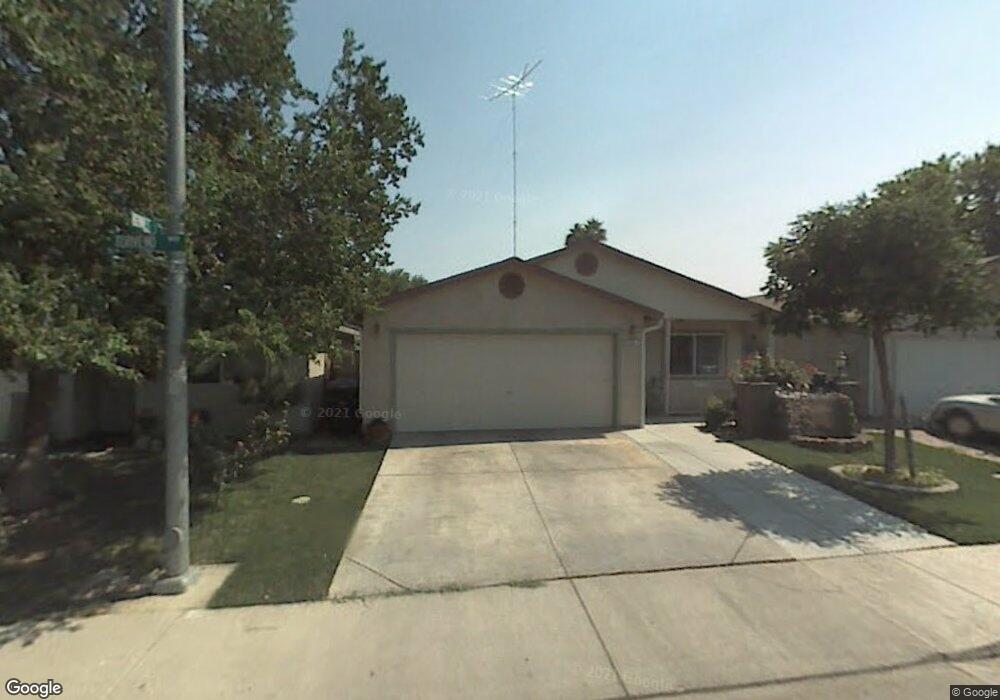
196 Torvend Way Patterson, CA 95363
Estimated Value: $342,000 - $409,000
3
Beds
2
Baths
1,299
Sq Ft
$297/Sq Ft
Est. Value
About This Home
This home is located at 196 Torvend Way, Patterson, CA 95363 and is currently estimated at $386,088, approximately $297 per square foot. 196 Torvend Way is a home located in Stanislaus County with nearby schools including Walnut Grove Elementary School, Creekside Middle School, and Patterson High School.
Ownership History
Date
Name
Owned For
Owner Type
Purchase Details
Closed on
Feb 25, 2015
Sold by
Ruiz Gonzalez Francisco Medina and Ruiz Salomon Evelia
Bought by
Ruiz Gonzalez Francisco Medina and Ruiz Salomon Evelia
Current Estimated Value
Home Financials for this Owner
Home Financials are based on the most recent Mortgage that was taken out on this home.
Original Mortgage
$120,000
Outstanding Balance
$42,524
Interest Rate
3.73%
Mortgage Type
New Conventional
Estimated Equity
$343,564
Purchase Details
Closed on
Feb 19, 2004
Sold by
Ruiz Evelia
Bought by
Ruiz Evella and Medina Francisco
Home Financials for this Owner
Home Financials are based on the most recent Mortgage that was taken out on this home.
Original Mortgage
$93,300
Interest Rate
5.85%
Mortgage Type
New Conventional
Purchase Details
Closed on
May 10, 2001
Sold by
Self Help Enterprises
Bought by
Ruiz Evelia
Home Financials for this Owner
Home Financials are based on the most recent Mortgage that was taken out on this home.
Original Mortgage
$61,003
Interest Rate
6.89%
Create a Home Valuation Report for This Property
The Home Valuation Report is an in-depth analysis detailing your home's value as well as a comparison with similar homes in the area
Home Values in the Area
Average Home Value in this Area
Purchase History
| Date | Buyer | Sale Price | Title Company |
|---|---|---|---|
| Ruiz Gonzalez Francisco Medina | -- | Chicago Title Company | |
| Ruiz Evella | -- | Fidelity National Title | |
| Ruiz Evelia | $24,000 | Fidelity National Title Co |
Source: Public Records
Mortgage History
| Date | Status | Borrower | Loan Amount |
|---|---|---|---|
| Open | Ruiz Gonzalez Francisco Medina | $120,000 | |
| Closed | Ruiz Evella | $93,300 | |
| Closed | Ruiz Evelia | $61,003 | |
| Closed | Ruiz Evelia | $23,600 |
Source: Public Records
Tax History
| Year | Tax Paid | Tax Assessment Tax Assessment Total Assessment is a certain percentage of the fair market value that is determined by local assessors to be the total taxable value of land and additions on the property. | Land | Improvement |
|---|---|---|---|---|
| 2025 | $2,817 | $233,391 | $36,153 | $197,238 |
| 2024 | $2,804 | $228,816 | $35,445 | $193,371 |
| 2023 | $2,748 | $224,330 | $34,750 | $189,580 |
| 2022 | $2,597 | $219,932 | $34,069 | $185,863 |
| 2021 | $2,562 | $215,620 | $33,401 | $182,219 |
| 2020 | $2,563 | $213,410 | $33,059 | $180,351 |
| 2019 | $2,525 | $209,226 | $32,411 | $176,815 |
| 2018 | $2,407 | $205,125 | $31,776 | $173,349 |
| 2017 | $2,359 | $201,103 | $31,153 | $169,950 |
| 2016 | $2,298 | $197,161 | $30,543 | $166,618 |
| 2015 | $1,968 | $167,000 | $23,000 | $144,000 |
| 2014 | $1,709 | $144,000 | $20,000 | $124,000 |
Source: Public Records
Map
Nearby Homes
- 192 Torvend Way
- 517 Nordell Place
- 1430 Walnut Ave
- 701 N 3rd St
- 445 M St
- 250 E Las Palmas Ave Unit 13
- 312 Roxanne Dr
- 801 Chatham Ln
- 800 Chatham Ln
- 813 Chatham Ln
- 804 Chatham Ln
- 817 Chatham Ln
- 140 Ivy Ave Unit A5
- 140 Ivy Ave Unit 39
- 821 Chatham Ln
- 812 Chatham Ln
- 816 Chatham Ln
- 829 Chatham Ln
- 820 Chatham Ln
- 833 Chatham Ln
- 200 Torvend Way
- 204 Torvend Way
- 188 Torvend Way
- 121 Washburn St
- 208 Torvend Way
- 501 Bennett Dr
- 125 Washburn St
- 119 Washburn St
- 212 Torvend Way
- 205 Torvend Way
- 505 Bennett Dr
- 227 Washburn St
- 117 Washburn St
- 209 Torvend Way
- 216 Torvend Way
- 213 Torvend Way
- 509 Bennett Dr
- 115 Washburn St
- 512 Bennett Dr
- 229 Washburn St
Your Personal Tour Guide
Ask me questions while you tour the home.