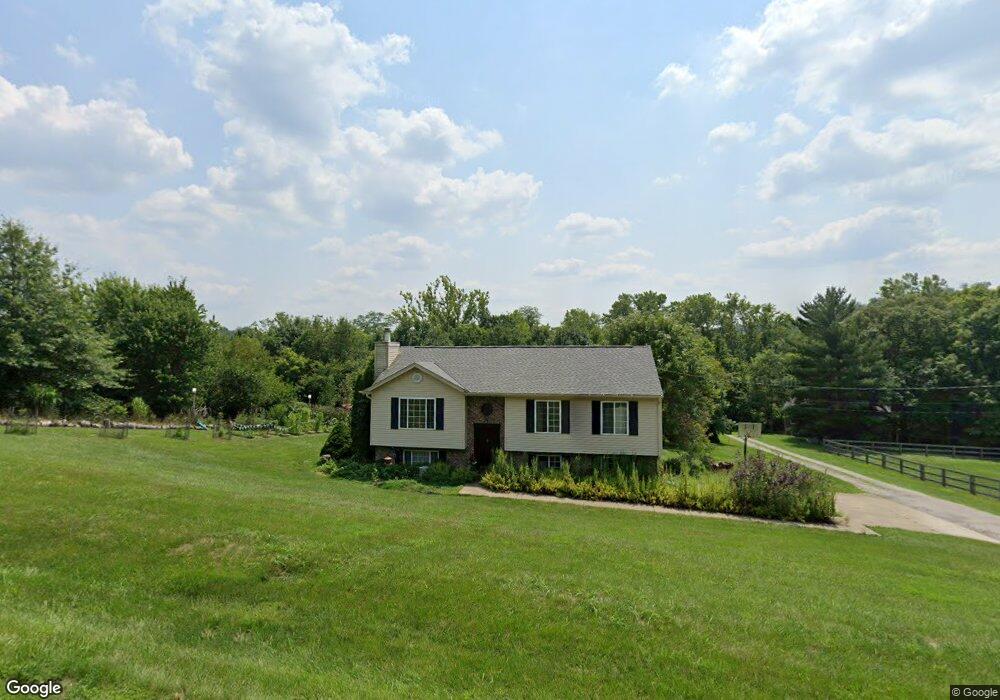
1979 Erion Rd Batavia, OH 45103
Estimated Value: $307,231 - $322,000
4
Beds
3
Baths
1,176
Sq Ft
$268/Sq Ft
Est. Value
About This Home
This home is located at 1979 Erion Rd, Batavia, OH 45103 and is currently estimated at $315,058, approximately $267 per square foot. 1979 Erion Rd is a home located in Clermont County with nearby schools including Batavia Elementary School, Batavia Middle School, and Batavia High School.
Ownership History
Date
Name
Owned For
Owner Type
Purchase Details
Closed on
Sep 6, 2005
Sold by
Hildebrandt Lisa R and Hildebrandt Mark
Bought by
Hildebrandt Mark A and Hildebrandt Lisa R
Current Estimated Value
Purchase Details
Closed on
Oct 23, 2003
Sold by
King Timothy A
Bought by
King Lisa R
Purchase Details
Closed on
Aug 28, 2001
Sold by
Zeiner Mark S
Bought by
King Timothy A and King Lisa R
Home Financials for this Owner
Home Financials are based on the most recent Mortgage that was taken out on this home.
Original Mortgage
$135,867
Outstanding Balance
$54,099
Interest Rate
7.28%
Mortgage Type
FHA
Estimated Equity
$260,959
Purchase Details
Closed on
Dec 10, 1998
Sold by
Casey Christopher A
Bought by
Zeiner Mark S and Zeiner Kimberly G
Home Financials for this Owner
Home Financials are based on the most recent Mortgage that was taken out on this home.
Original Mortgage
$117,900
Interest Rate
6.93%
Mortgage Type
New Conventional
Purchase Details
Closed on
Aug 10, 1993
Purchase Details
Closed on
Apr 13, 1993
Create a Home Valuation Report for This Property
The Home Valuation Report is an in-depth analysis detailing your home's value as well as a comparison with similar homes in the area
Home Values in the Area
Average Home Value in this Area
Purchase History
| Date | Buyer | Sale Price | Title Company |
|---|---|---|---|
| Hildebrandt Mark A | -- | -- | |
| King Lisa R | -- | -- | |
| King Timothy A | $138,000 | -- | |
| Zeiner Mark S | $131,000 | -- | |
| -- | $108,000 | -- | |
| -- | $13,000 | -- |
Source: Public Records
Mortgage History
| Date | Status | Borrower | Loan Amount |
|---|---|---|---|
| Open | King Timothy A | $135,867 | |
| Previous Owner | Zeiner Mark S | $117,900 |
Source: Public Records
Tax History
| Year | Tax Paid | Tax Assessment Tax Assessment Total Assessment is a certain percentage of the fair market value that is determined by local assessors to be the total taxable value of land and additions on the property. | Land | Improvement |
|---|---|---|---|---|
| 2024 | $2,615 | $70,670 | $14,980 | $55,690 |
| 2023 | $2,620 | $70,670 | $14,980 | $55,690 |
| 2022 | $2,635 | $52,920 | $11,200 | $41,720 |
| 2021 | $2,659 | $52,920 | $11,200 | $41,720 |
| 2020 | $2,673 | $52,920 | $11,200 | $41,720 |
| 2019 | $2,623 | $48,660 | $11,870 | $36,790 |
| 2018 | $2,713 | $48,660 | $11,870 | $36,790 |
| 2017 | $2,280 | $48,660 | $11,870 | $36,790 |
| 2016 | $2,280 | $43,050 | $10,500 | $32,550 |
| 2015 | $2,165 | $43,050 | $10,500 | $32,550 |
| 2014 | $2,165 | $43,050 | $10,500 | $32,550 |
| 2013 | $2,260 | $43,820 | $10,500 | $33,320 |
Source: Public Records
Map
Nearby Homes
- A Douglas Dr
- 393 Clark St
- 1 Ely St
- 1323 Anacapa Ct
- 2280 Siesta Dr
- 625 College Dr
- 3957 Ohio 132
- 2124 Commons Cir
- 4263 Fox Ridge Dr
- 2021 Commons Cir Unit 2F
- 0 St Rt 132 Unit 1860682
- 2115 Crossridge Dr
- 2214 Trappers Knoll Dr
- 2140 Crossridge Dr
- 4333 Cordial Place
- 3807 Lucy Run Cemetery Rd
- 4247 Glenstream Dr
- 2188 Winemiller Ln
- 6030 Filager Rd
- 4327 Cedar Grove Ct
- 1963 Erion Rd
- 1964 Erion Rd
- 1960 Erion Rd
- 1969 Erion Rd
- 1955 Erion Rd
- 1985 Erion Rd
- 1952 Erion Rd
- 1995 Erion Rd
- 4029 State Route 222
- 1986 Erion Rd
- 4100 State Route 222
- 89.9ac Ohio 222
- A Ohio 222
- B Ohio 222
- 103 Alexas Way
- 1672 St Rt 125
- 4101 Old South Riverside Dr
- 2006 Erion Rd
- 2030 Erion Rd
- 2008 Erion Rd
Your Personal Tour Guide
Ask me questions while you tour the home.