Estimated Value: $1,058,893 - $1,083,000
7
Beds
4
Baths
4,580
Sq Ft
$235/Sq Ft
Est. Value
About This Home
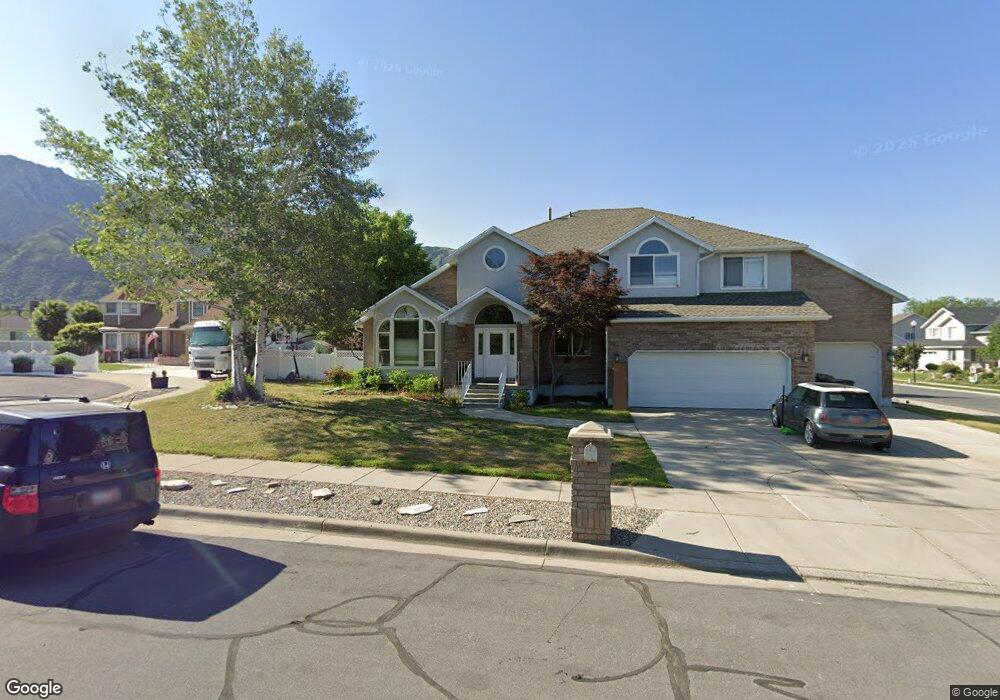
This home is located at 1988 E Wyngate Cir, Sandy, UT 84092 and is currently estimated at $1,074,223, approximately $234 per square foot. 1988 E Wyngate Cir is a home located in Salt Lake County with nearby schools including Sunrise Elementary School, Bell Canyon Montessori School, and Challenger School - Sandy.
Ownership History
Date
Name
Owned For
Owner Type
Purchase Details
Closed on
Feb 28, 2020
Sold by
Jones Scott Austin
Bought by
Jones Scott A and Jones Tamara R
Current Estimated Value
Home Financials for this Owner
Home Financials are based on the most recent Mortgage that was taken out on this home.
Original Mortgage
$386,400
Outstanding Balance
$342,858
Interest Rate
3.6%
Mortgage Type
New Conventional
Estimated Equity
$731,365
Purchase Details
Closed on
Sep 15, 2015
Sold by
Angerbauer Jeffrey A and Angerbauer Suzanne B
Bought by
Jones Scott Austin
Home Financials for this Owner
Home Financials are based on the most recent Mortgage that was taken out on this home.
Original Mortgage
$408,321
Interest Rate
3.86%
Mortgage Type
New Conventional
Purchase Details
Closed on
Feb 15, 2008
Sold by
Weddick Anthony J and Weddick Sharon B
Bought by
Angerbauer Jeffrey A and Angerbauer Suzanne B
Home Financials for this Owner
Home Financials are based on the most recent Mortgage that was taken out on this home.
Original Mortgage
$49,995
Interest Rate
5.64%
Mortgage Type
Credit Line Revolving
Create a Home Valuation Report for This Property
The Home Valuation Report is an in-depth analysis detailing your home's value as well as a comparison with similar homes in the area
Home Values in the Area
Average Home Value in this Area
Purchase History
| Date | Buyer | Sale Price | Title Company |
|---|---|---|---|
| Jones Scott A | -- | North American Title Llc | |
| Jones Scott Austin | -- | North American Title Llc | |
| Angerbauer Jeffrey A | -- | Equity Title |
Source: Public Records
Mortgage History
| Date | Status | Borrower | Loan Amount |
|---|---|---|---|
| Open | Jones Scott A | $386,400 | |
| Closed | Jones Scott Austin | $408,321 | |
| Previous Owner | Angerbauer Jeffrey A | $49,995 | |
| Previous Owner | Angerbauer Jeffrey A | $400,000 |
Source: Public Records
Tax History
| Year | Tax Paid | Tax Assessment Tax Assessment Total Assessment is a certain percentage of the fair market value that is determined by local assessors to be the total taxable value of land and additions on the property. | Land | Improvement |
|---|---|---|---|---|
| 2025 | $4,956 | $953,000 | $329,100 | $623,900 |
| 2024 | $4,956 | $916,500 | $316,800 | $599,700 |
| 2023 | $4,587 | $845,800 | $304,700 | $541,100 |
| 2022 | $4,854 | $874,500 | $298,700 | $575,800 |
| 2021 | $3,986 | $611,200 | $247,200 | $364,000 |
| 2020 | $4,202 | $607,600 | $247,200 | $360,400 |
| 2019 | $4,039 | $569,100 | $238,300 | $330,800 |
| 2017 | $3,698 | $518,300 | $238,300 | $280,000 |
| 2016 | $3,479 | $471,400 | $214,800 | $256,600 |
Source: Public Records
Map
Nearby Homes
- 11129 S 2125 E
- 11318 Canyon Falls Ln
- 7 Rollingwood Ln
- 11382 S Canyon Falls Ln
- 2234 E Willow Brook Way
- 2192 E High Mesa Dr
- 2148 E Pinecrest Ln
- 16 Gatehouse Ln
- 2026 E 10765 S
- 1653 Crescent View Dr
- 1 Quietwood Ln
- 2122 Wasatch Blvd
- 11446 S 2320 E
- 11341 S Silver Buckle Way
- 2232 E Lone Eagle Ln
- 5 Quietwood Ln
- 2015 E Dimple Dell Rd
- 11779 S Windcroft Ct
- 11037 E Robinson Curcle
- 10868 Prescott Dr
- 1984 Wyngate Cir
- 11237 S Wyngate Ln
- 11237 Wyngate Ln
- 2002 Wyngate Cir
- 11187 Wyngate Ln
- 11212 Wyngate Ln
- 11224 Wyngate Ln
- 2001 E Wyngate Cir
- 2001 Wyngate Cir
- 1999 E Tall Pines Way
- 2008 Wyngate Cir
- 2008 E Wyngate Cir
- 11198 Wyngate Ln
- 11238 S Wyngate Ln
- 11238 Wyngate Ln
- 1999 Tall Pines Way
- 2021 Tall Pines Way
- 2009 Wyngate Cir
- 2009 E Wyngate Cir
- 1998 Barrett Park Dr
Your Personal Tour Guide
Ask me questions while you tour the home.