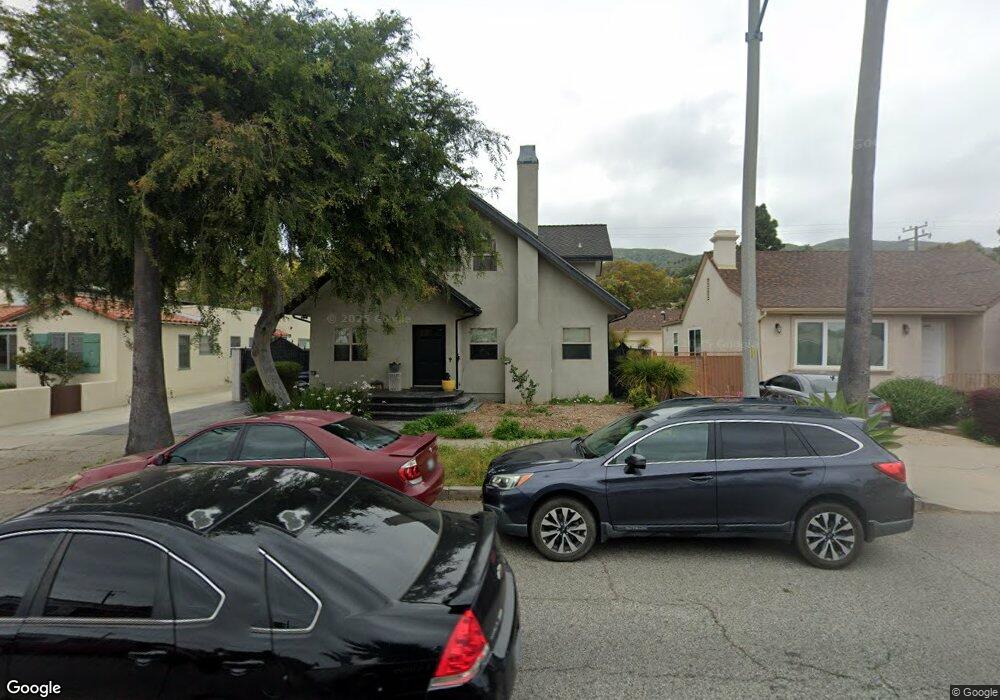
1993 Poli St Ventura, CA 93001
Midtown NeighborhoodEstimated Value: $1,362,652 - $1,704,000
4
Beds
3
Baths
2,408
Sq Ft
$618/Sq Ft
Est. Value
About This Home
This home is located at 1993 Poli St, Ventura, CA 93001 and is currently estimated at $1,489,163, approximately $618 per square foot. 1993 Poli St is a home located in Ventura County with nearby schools including Lincoln Elementary School, Cabrillo Middle School, and Ventura High School.
Ownership History
Date
Name
Owned For
Owner Type
Purchase Details
Closed on
Mar 29, 2017
Sold by
Connelly Alana E
Bought by
Connelly Alana
Current Estimated Value
Purchase Details
Closed on
Nov 10, 2015
Sold by
Connelly Jeffrey L and Connelly Alana E
Bought by
Connelly Alana E
Home Financials for this Owner
Home Financials are based on the most recent Mortgage that was taken out on this home.
Original Mortgage
$230,000
Outstanding Balance
$180,721
Interest Rate
3.76%
Mortgage Type
New Conventional
Estimated Equity
$1,308,442
Purchase Details
Closed on
Apr 16, 1998
Sold by
Hodges Lillian J
Bought by
Connelly Jeffery L and Connelly Alana E
Home Financials for this Owner
Home Financials are based on the most recent Mortgage that was taken out on this home.
Original Mortgage
$174,195
Interest Rate
7.11%
Mortgage Type
FHA
Create a Home Valuation Report for This Property
The Home Valuation Report is an in-depth analysis detailing your home's value as well as a comparison with similar homes in the area
Home Values in the Area
Average Home Value in this Area
Purchase History
| Date | Buyer | Sale Price | Title Company |
|---|---|---|---|
| Connelly Alana | -- | None Available | |
| Connelly Alana E | -- | Pacific Coast Title | |
| Connelly Jeffery L | $185,000 | American Title Co |
Source: Public Records
Mortgage History
| Date | Status | Borrower | Loan Amount |
|---|---|---|---|
| Open | Connelly Alana E | $230,000 | |
| Previous Owner | Connelly Jeffery L | $174,195 |
Source: Public Records
Tax History Compared to Growth
Tax History
| Year | Tax Paid | Tax Assessment Tax Assessment Total Assessment is a certain percentage of the fair market value that is determined by local assessors to be the total taxable value of land and additions on the property. | Land | Improvement |
|---|---|---|---|---|
| 2025 | $5,436 | $505,883 | $207,561 | $298,322 |
| 2024 | $5,436 | $495,964 | $203,491 | $292,473 |
| 2023 | $5,370 | $486,240 | $199,501 | $286,739 |
| 2022 | $5,001 | $476,706 | $195,589 | $281,117 |
| 2021 | $4,977 | $467,359 | $191,754 | $275,605 |
| 2020 | $4,930 | $462,569 | $189,789 | $272,780 |
| 2019 | $4,839 | $453,500 | $186,068 | $267,432 |
| 2018 | $4,759 | $444,609 | $182,420 | $262,189 |
| 2017 | $4,659 | $435,893 | $178,844 | $257,049 |
| 2016 | $4,569 | $427,347 | $175,338 | $252,009 |
| 2015 | $4,447 | $420,930 | $172,705 | $248,225 |
| 2014 | $4,374 | $412,686 | $169,323 | $243,363 |
Source: Public Records
Map
Nearby Homes
- 258 N Linda Vista Ave
- 325 N Catalina St
- 1871 Terrace Dr
- 44 Coronado St Unit 202
- 66 San Clemente St
- Plan D at Portalvo - Townhomes
- Plan F at Portalvo - Townhomes
- Plan E at Portalvo - Townhomes
- Plan O at Portalvo - Condos/Flats
- Plan A at Portalvo - Townhomes
- Plan H at Portalvo - Condos/Flats
- Plan L at Portalvo - Condos/Flats
- Plan C at Portalvo - Townhomes
- Plan B at Portalvo - Townhomes
- Plan J at Portalvo - Condos/Flats
- Plan G at Portalvo - Townhomes
- Plan N at Portalvo - Condos/Flats
- Plan K at Portalvo - Condos/Flats
- Plan M at Portalvo - Condos/Flats
- 1806 Sunset Dr