Estimated Value: $418,000 - $449,000
3
Beds
1
Bath
1,104
Sq Ft
$392/Sq Ft
Est. Value
About This Home
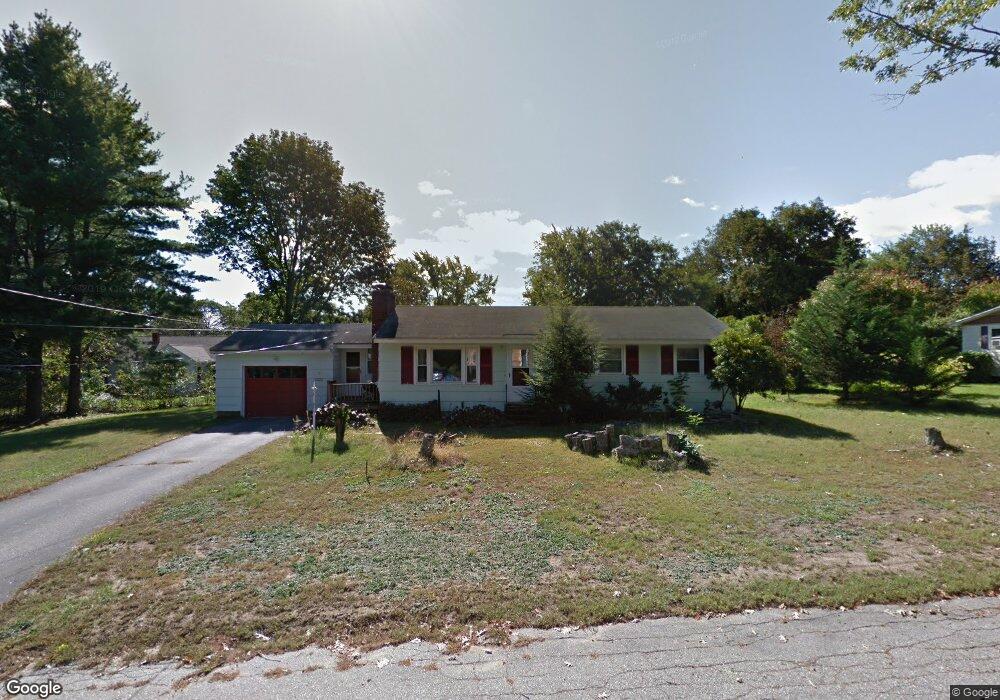
This home is located at 2 Barry St, Dover, NH 03820 and is currently estimated at $432,300, approximately $391 per square foot. 2 Barry St is a home located in Strafford County with nearby schools including Horne Street School, Dover Middle School, and Dover Senior High School.
Ownership History
Date
Name
Owned For
Owner Type
Purchase Details
Closed on
May 1, 2000
Sold by
Howard Perley R and Howard Patricia A
Bought by
Yau Jonathan C L
Current Estimated Value
Home Financials for this Owner
Home Financials are based on the most recent Mortgage that was taken out on this home.
Original Mortgage
$151,278
Interest Rate
8.23%
Purchase Details
Closed on
Jul 21, 1998
Sold by
Reed Sandra L
Bought by
Howard Patricia A and Howard Perley R
Home Financials for this Owner
Home Financials are based on the most recent Mortgage that was taken out on this home.
Original Mortgage
$101,000
Interest Rate
6.98%
Purchase Details
Closed on
Oct 16, 1996
Sold by
Whitney Gayle P
Bought by
Snow Angelique M
Home Financials for this Owner
Home Financials are based on the most recent Mortgage that was taken out on this home.
Original Mortgage
$48,000
Interest Rate
8.26%
Create a Home Valuation Report for This Property
The Home Valuation Report is an in-depth analysis detailing your home's value as well as a comparison with similar homes in the area
Home Values in the Area
Average Home Value in this Area
Purchase History
| Date | Buyer | Sale Price | Title Company |
|---|---|---|---|
| Yau Jonathan C L | $151,400 | -- | |
| Howard Patricia A | $106,500 | -- | |
| Snow Angelique M | $80,000 | -- |
Source: Public Records
Mortgage History
| Date | Status | Borrower | Loan Amount |
|---|---|---|---|
| Open | Snow Angelique M | $130,135 | |
| Closed | Snow Angelique M | $151,278 | |
| Previous Owner | Snow Angelique M | $101,000 | |
| Previous Owner | Snow Angelique M | $48,000 |
Source: Public Records
Tax History
| Year | Tax Paid | Tax Assessment Tax Assessment Total Assessment is a certain percentage of the fair market value that is determined by local assessors to be the total taxable value of land and additions on the property. | Land | Improvement |
|---|---|---|---|---|
| 2024 | $7,032 | $387,000 | $138,600 | $248,400 |
| 2023 | $6,672 | $356,800 | $146,700 | $210,100 |
| 2022 | $6,597 | $332,500 | $146,700 | $185,800 |
| 2021 | $6,467 | $298,000 | $130,400 | $167,600 |
| 2020 | $5,835 | $234,800 | $101,900 | $132,900 |
| 2019 | $6,051 | $240,200 | $110,000 | $130,200 |
| 2018 | $5,542 | $222,400 | $97,800 | $124,600 |
| 2017 | $5,239 | $202,500 | $81,500 | $121,000 |
| 2016 | $4,795 | $182,400 | $72,400 | $110,000 |
| 2015 | $4,784 | $179,800 | $72,400 | $107,400 |
| 2014 | $4,677 | $179,800 | $72,400 | $107,400 |
| 2011 | $4,406 | $175,400 | $68,800 | $106,600 |
Source: Public Records
Map
Nearby Homes
- 9 Lowell Ave
- Lot 0 Page Ave
- 0 Indian Brook Rd Unit C
- 725 Central Ave Unit 203
- 725 Central Ave Unit LL03
- 725 Central Ave Unit 301
- 725 Central Ave Unit 302
- 725 Central Ave Unit LL01
- 725 Central Ave Unit 304
- 80 Glenwood Ave
- 34 Floral Ave Unit 5
- 63 Sixth St
- 472 High St
- 20 Baker St
- 47 Central Ave
- 0 4th St Unit 2
- 18 5th St
- 24 Preble St
- 35 First St
- 5 Prospect St
- 19 Glenwood Ave
- 17 Glenwood Ave
- 1 Barry St
- 1 Smith Well Rd
- 21 Glenwood Ave
- 3 Smith Well Rd
- 25 Glenwood Ave
- 6 Barry St
- 18 Glenwood Ave
- 16 Glenwood Ave
- 2 Smith Well Rd
- 15 Glenwood Ave
- 3 Barry St
- 14 Glenwood Ave
- 22 Glenwood Ave
- 14 Glencrest Ave
- 24 Glenwood Ave
- 5 Barry St
- 7 Glenwood Ave Unit . C
- 11 Glenwood Ave
Your Personal Tour Guide
Ask me questions while you tour the home.