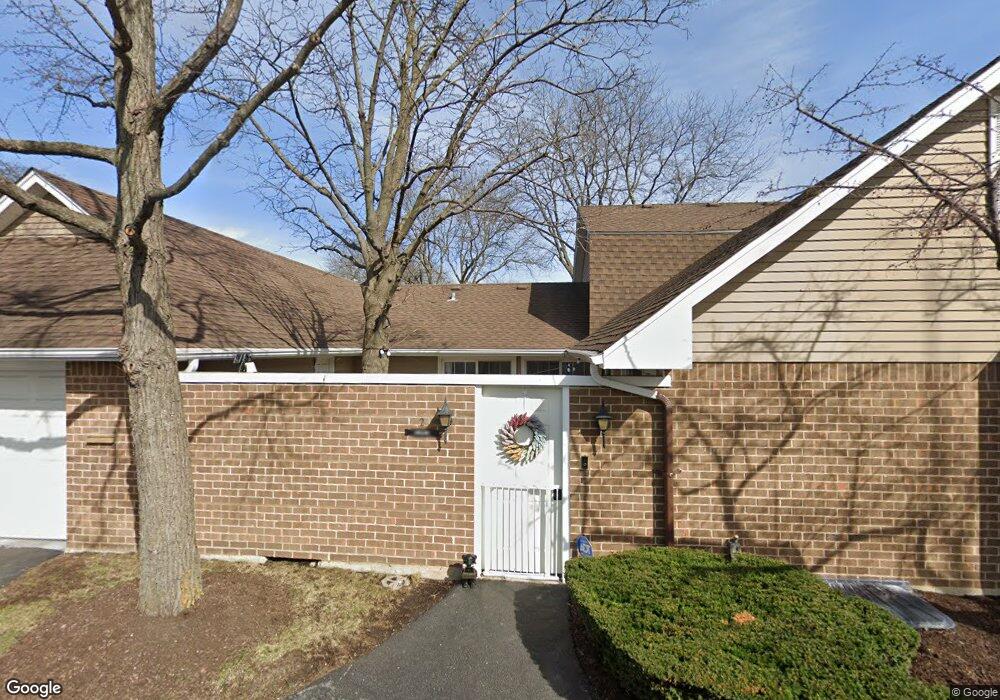
2 Comstock on Asbury Rolling Meadows, IL 60008
Creekside NeighborhoodEstimated Value: $416,000 - $457,585
4
Beds
2
Baths
2,332
Sq Ft
$184/Sq Ft
Est. Value
About This Home
This home is located at 2 Comstock on Asbury, Rolling Meadows, IL 60008 and is currently estimated at $428,646, approximately $183 per square foot. 2 Comstock on Asbury is a home located in Cook County with nearby schools including Central Road Elementary School, Galatia Junior High School, and William Fremd High School.
Ownership History
Date
Name
Owned For
Owner Type
Purchase Details
Closed on
Jun 29, 2021
Sold by
Payes Marie M and The Marie M Payes Delcaration
Bought by
Arellano Victor and Arellano Michelle E
Current Estimated Value
Home Financials for this Owner
Home Financials are based on the most recent Mortgage that was taken out on this home.
Original Mortgage
$165,000
Outstanding Balance
$149,643
Interest Rate
2.87%
Mortgage Type
New Conventional
Estimated Equity
$279,003
Purchase Details
Closed on
Aug 8, 2005
Sold by
Payes Marie M
Bought by
Payes Marie M and Marie M Payes Declaration Of Trust
Create a Home Valuation Report for This Property
The Home Valuation Report is an in-depth analysis detailing your home's value as well as a comparison with similar homes in the area
Home Values in the Area
Average Home Value in this Area
Purchase History
| Date | Buyer | Sale Price | Title Company |
|---|---|---|---|
| Arellano Victor | $350,000 | Chicago Title | |
| Payes Marie M | -- | Cti |
Source: Public Records
Mortgage History
| Date | Status | Borrower | Loan Amount |
|---|---|---|---|
| Open | Arellano Victor | $165,000 |
Source: Public Records
Tax History Compared to Growth
Tax History
| Year | Tax Paid | Tax Assessment Tax Assessment Total Assessment is a certain percentage of the fair market value that is determined by local assessors to be the total taxable value of land and additions on the property. | Land | Improvement |
|---|---|---|---|---|
| 2024 | $7,588 | $30,001 | $5,001 | $25,000 |
| 2023 | $7,248 | $30,001 | $5,001 | $25,000 |
| 2022 | $7,248 | $30,001 | $5,001 | $25,000 |
| 2021 | $6,103 | $23,847 | $3,527 | $20,320 |
| 2020 | $6,144 | $23,847 | $3,527 | $20,320 |
| 2019 | $6,191 | $26,645 | $3,527 | $23,118 |
| 2018 | $7,883 | $29,729 | $3,135 | $26,594 |
| 2017 | $7,757 | $29,729 | $3,135 | $26,594 |
| 2016 | $7,768 | $29,729 | $3,135 | $26,594 |
| 2015 | $6,743 | $25,163 | $2,874 | $22,289 |
| 2014 | $6,627 | $25,163 | $2,874 | $22,289 |
| 2013 | $6,432 | $25,163 | $2,874 | $22,289 |
Source: Public Records
Map
Nearby Homes
- 2600 Brookwood Way Dr Unit 316
- 2600 Brookwood Way Dr Unit 305
- 2600 Brookwood Unit 314
- 2600 Brookwood Way Dr Unit 212
- 200 Edgewood Ln
- 3805 Fairfax Ave
- 208 Brookdale Ln
- 3400 Wellington Ct Unit 306
- 3355 Kirchoff Rd Unit 6A
- 160 E Forest Ln
- 3265 Kirchoff Rd Unit 223
- 3600 Owl Dr
- 2401 Rohlwing Rd
- 3125 Town Square Dr Unit 408
- 372 Longacres Ln
- 2041 Vermont St
- 4301 Euclid Ave
- 4101 Owl Dr
- 3316 Trillium Cir
- 2 Croydon on Duxbury
- 5 Auburn Unit 5
- 4 Comstock on Asbury
- 7 Auburn
- 1 Comstock on Asbury
- 4 Pepperell on Asbury
- 2 Pepperell on Asbury
- 2 Old Saybrook on Auburn
- 1 Pocasset on Asbury
- 3 Auburn Unit 1
- 2 Auburn
- 2 Pocasset on Asbury
- 5 Juniper Rd
- 4 Old Saybrook on Auburn
- 3 Pocasset on Asbury
- 3 Pepperell on Asbury
- 914 Auburn Dr Unit 914
- 4 Pocasset on Asbury Unit 2
- 1 Auburn
- 1 Pepperell on Asbury
- 4 Auburn