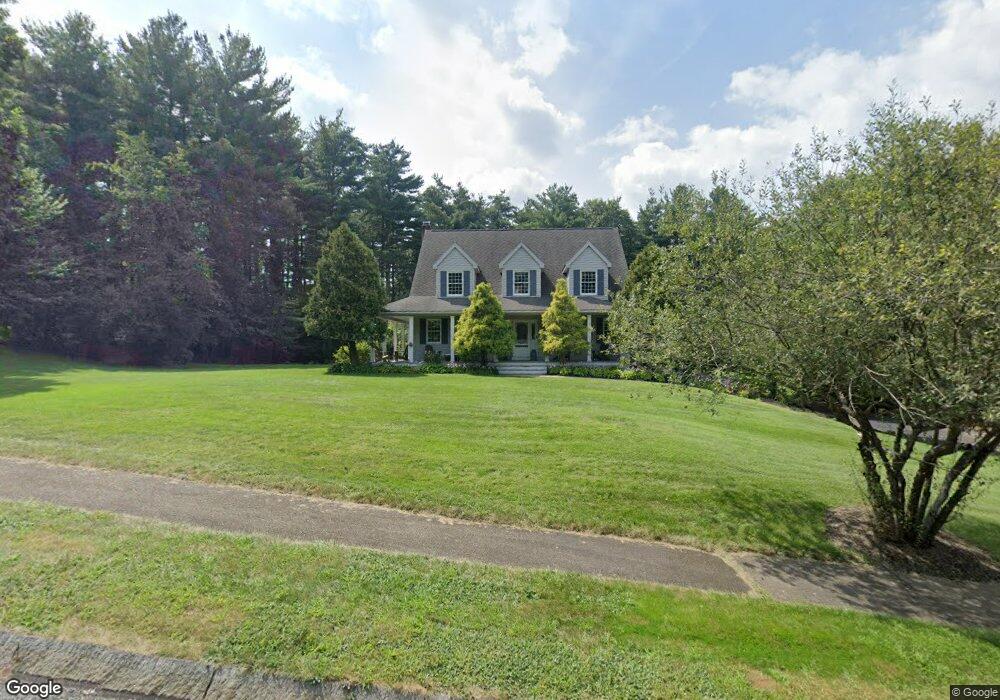
2 Emilio Dr Franklin, MA 02038
Wadsworth NeighborhoodEstimated Value: $810,532 - $997,000
3
Beds
4
Baths
2,092
Sq Ft
$416/Sq Ft
Est. Value
About This Home
This home is located at 2 Emilio Dr, Franklin, MA 02038 and is currently estimated at $870,133, approximately $415 per square foot. 2 Emilio Dr is a home located in Norfolk County with nearby schools including Jefferson Elementary School, Remington Middle School, and Franklin High School.
Ownership History
Date
Name
Owned For
Owner Type
Purchase Details
Closed on
Dec 19, 2017
Sold by
Boudreau Willis L and Boudreau Linda A
Bought by
Boudreau Ft
Current Estimated Value
Create a Home Valuation Report for This Property
The Home Valuation Report is an in-depth analysis detailing your home's value as well as a comparison with similar homes in the area
Home Values in the Area
Average Home Value in this Area
Purchase History
| Date | Buyer | Sale Price | Title Company |
|---|---|---|---|
| Boudreau Ft | -- | -- |
Source: Public Records
Tax History Compared to Growth
Tax History
| Year | Tax Paid | Tax Assessment Tax Assessment Total Assessment is a certain percentage of the fair market value that is determined by local assessors to be the total taxable value of land and additions on the property. | Land | Improvement |
|---|---|---|---|---|
| 2025 | $9,390 | $808,100 | $374,800 | $433,300 |
| 2024 | $9,611 | $815,200 | $374,800 | $440,400 |
| 2023 | $9,143 | $726,800 | $358,200 | $368,600 |
| 2022 | $8,517 | $606,200 | $277,700 | $328,500 |
| 2021 | $8,203 | $559,900 | $267,400 | $292,500 |
| 2020 | $7,976 | $549,700 | $270,100 | $279,600 |
| 2019 | $7,739 | $527,900 | $248,500 | $279,400 |
| 2018 | $7,554 | $515,600 | $262,000 | $253,600 |
| 2017 | $7,636 | $523,700 | $270,100 | $253,600 |
| 2016 | $7,343 | $506,400 | $249,100 | $257,300 |
| 2015 | $7,162 | $482,600 | $225,300 | $257,300 |
| 2014 | $6,936 | $480,000 | $216,600 | $263,400 |
Source: Public Records
Map
Nearby Homes
- 732 King St
- 246 Washington St
- 10 Stanford Rd
- 417 Union St
- 374-378 Union St
- 0 Fall Ln
- 7 Howard Place
- 1 Spring St
- 32 Dale St
- 99 Summer St
- 82 Uncas Ave Unit 1
- 215 Forest St
- 955 Summer St
- 70 Uncas Ave
- 64 Uncas Ave
- 90 E Central St Unit 103
- 90 E Central St Unit 106
- 90 E Central St Unit 304
- 90 E Central St Unit 202
- 90 E Central St Unit 105