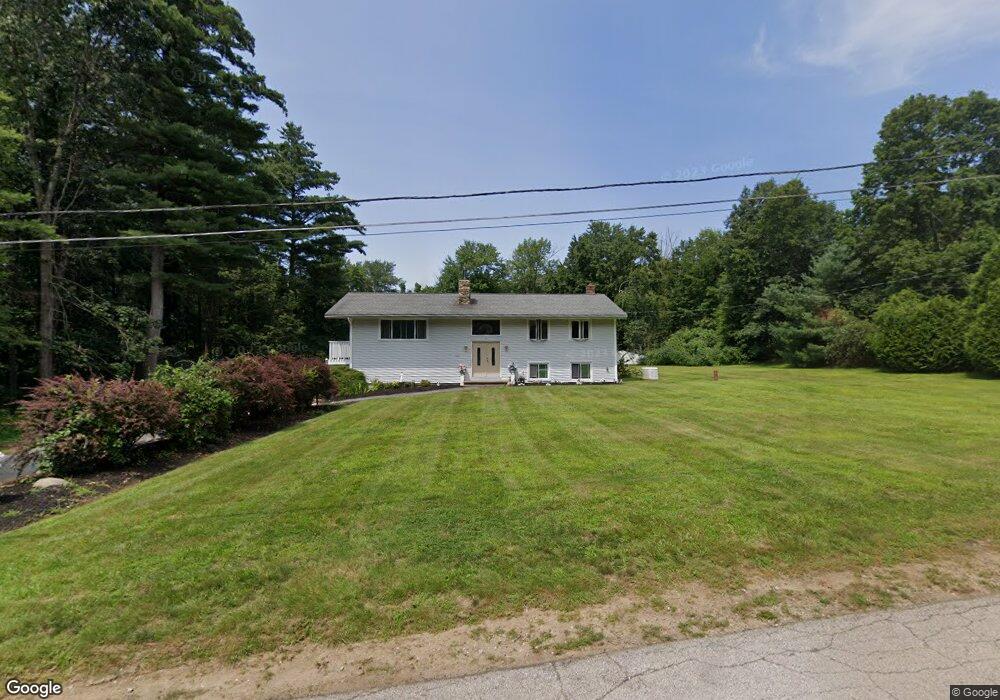
2 Hayes Hart Rd Windham, NH 03087
Estimated Value: $610,000 - $686,000
3
Beds
2
Baths
2,184
Sq Ft
$298/Sq Ft
Est. Value
About This Home
This home is located at 2 Hayes Hart Rd, Windham, NH 03087 and is currently estimated at $651,373, approximately $298 per square foot. 2 Hayes Hart Rd is a home located in Rockingham County with nearby schools including Golden Brook Elementary School, Windham Middle School, and Windham High School.
Ownership History
Date
Name
Owned For
Owner Type
Purchase Details
Closed on
Jan 13, 2023
Sold by
Pudil Andrew and Qualter Katie
Bought by
Smith James H and Smith Kelsey
Current Estimated Value
Purchase Details
Closed on
Oct 29, 2014
Sold by
Harris Sharon L
Bought by
Feroce Domenic A
Purchase Details
Closed on
Jun 27, 2014
Sold by
Feroce Domenic A
Bought by
Feroce Domenic A and Harris Sharon L
Purchase Details
Closed on
Apr 22, 2011
Sold by
Mtm Rt
Bought by
Feroce Domenic
Home Financials for this Owner
Home Financials are based on the most recent Mortgage that was taken out on this home.
Original Mortgage
$263,155
Interest Rate
4.9%
Mortgage Type
Purchase Money Mortgage
Create a Home Valuation Report for This Property
The Home Valuation Report is an in-depth analysis detailing your home's value as well as a comparison with similar homes in the area
Home Values in the Area
Average Home Value in this Area
Purchase History
| Date | Buyer | Sale Price | Title Company |
|---|---|---|---|
| Smith James H | $498,000 | None Available | |
| Feroce Domenic A | -- | -- | |
| Feroce Domenic A | -- | -- | |
| Feroce Domenic | $270,000 | -- |
Source: Public Records
Mortgage History
| Date | Status | Borrower | Loan Amount |
|---|---|---|---|
| Previous Owner | Feroce Domenic | $263,155 | |
| Previous Owner | Feroce Domenic | $11,000 | |
| Previous Owner | Feroce Domenic | $168,000 |
Source: Public Records
Tax History Compared to Growth
Tax History
| Year | Tax Paid | Tax Assessment Tax Assessment Total Assessment is a certain percentage of the fair market value that is determined by local assessors to be the total taxable value of land and additions on the property. | Land | Improvement |
|---|---|---|---|---|
| 2024 | $8,180 | $361,300 | $155,900 | $205,400 |
| 2023 | $7,732 | $361,300 | $155,900 | $205,400 |
| 2022 | $7,139 | $361,300 | $155,900 | $205,400 |
| 2021 | $6,727 | $361,300 | $155,900 | $205,400 |
| 2020 | $6,912 | $361,300 | $155,900 | $205,400 |
| 2019 | $6,255 | $277,400 | $142,900 | $134,500 |
| 2018 | $6,461 | $277,400 | $142,900 | $134,500 |
| 2017 | $5,603 | $277,400 | $142,900 | $134,500 |
| 2016 | $6,053 | $277,400 | $142,900 | $134,500 |
| 2015 | $6,110 | $281,300 | $142,900 | $138,400 |
| 2014 | $6,449 | $268,700 | $154,000 | $114,700 |
| 2013 | $6,221 | $263,600 | $154,000 | $109,600 |
Source: Public Records
Map
Nearby Homes
- 25 Range Rd
- 10 Roulston Rd
- 174 N Policy St
- 10 Harris Rd
- 17 Cole Rd
- 2 Dennison Ave
- 85 Shadow Lake Rd
- 63 Searles Rd
- 70 Governor Dinsmore Rd
- 24 Rolling Ridge Rd
- 6 Chadwick Cir
- 54 Enterprise Dr
- 3 S Shore Rd
- 44 Trails Edge Rd
- 41 Trails Edge Rd
- 15 Enterprise Dr
- 30 Scotland Ave
- 108 S Shore Rd
- 24 Rockingham Rd
- 51 Zion Hill Rd