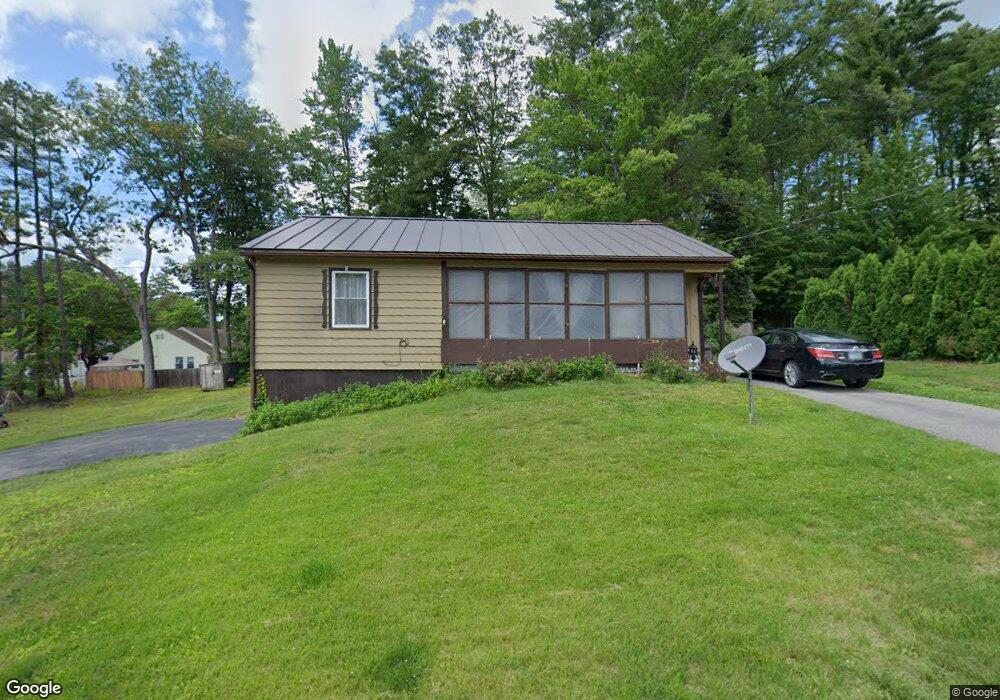
2 N Sulloway St Franklin, NH 03235
Estimated Value: $258,000 - $345,000
2
Beds
2
Baths
1,238
Sq Ft
$249/Sq Ft
Est. Value
About This Home
This home is located at 2 N Sulloway St, Franklin, NH 03235 and is currently estimated at $308,532, approximately $249 per square foot. 2 N Sulloway St is a home located in Merrimack County with nearby schools including Paul A. Smith School, Franklin Middle School, and Franklin High School.
Ownership History
Date
Name
Owned For
Owner Type
Purchase Details
Closed on
Jun 20, 2019
Sold by
Chester F Kulus Rt
Bought by
Dimond Leland C and Dimond Peggy A
Current Estimated Value
Home Financials for this Owner
Home Financials are based on the most recent Mortgage that was taken out on this home.
Original Mortgage
$86,670
Outstanding Balance
$76,204
Interest Rate
4.1%
Mortgage Type
Purchase Money Mortgage
Estimated Equity
$232,328
Purchase Details
Closed on
Oct 23, 2018
Sold by
Kulus Chester F
Bought by
Chester F Kulus T
Create a Home Valuation Report for This Property
The Home Valuation Report is an in-depth analysis detailing your home's value as well as a comparison with similar homes in the area
Home Values in the Area
Average Home Value in this Area
Purchase History
| Date | Buyer | Sale Price | Title Company |
|---|---|---|---|
| Dimond Leland C | $108,400 | -- | |
| Chester F Kulus T | -- | -- |
Source: Public Records
Mortgage History
| Date | Status | Borrower | Loan Amount |
|---|---|---|---|
| Open | Dimond Leland C | $86,670 |
Source: Public Records
Tax History Compared to Growth
Tax History
| Year | Tax Paid | Tax Assessment Tax Assessment Total Assessment is a certain percentage of the fair market value that is determined by local assessors to be the total taxable value of land and additions on the property. | Land | Improvement |
|---|---|---|---|---|
| 2024 | $4,227 | $246,500 | $75,300 | $171,200 |
| 2023 | $4,008 | $246,500 | $75,300 | $171,200 |
| 2022 | $3,583 | $146,900 | $61,800 | $85,100 |
| 2021 | $3,410 | $146,900 | $61,800 | $85,100 |
| 2020 | $3,353 | $146,800 | $61,800 | $85,000 |
| 2019 | $3,290 | $146,400 | $61,800 | $84,600 |
| 2018 | $3,215 | $146,400 | $61,800 | $84,600 |
| 2017 | $2,932 | $114,700 | $28,300 | $86,400 |
| 2016 | $2,896 | $114,800 | $28,300 | $86,500 |
| 2015 | $2,105 | $84,350 | $19,810 | $64,540 |
| 2011 | $2,869 | $133,300 | $31,800 | $101,500 |
Source: Public Records
Map
Nearby Homes
- 0 Rowell Dr Unit 406 5043422
- 38 Park St
- 414 Central St
- 400 Central St Unit 204
- 359 Central St Unit 3
- 624 Central St
- 11 Racine St
- 9 Hunt Ave
- 75 School St
- 88 Franklin St
- 30 River St
- 57 Oak St
- 150 Victory Dr
- 193 Kendall St
- 123 Franklin St
- 135 Franklin St
- 721 Central St
- 30 Duffy St
- 21 Mountain View Dr
- 261 N Main St
- 1 Freedom Dr
- 16 N Sulloway St
- 59 Edwards St
- 3 Freedom Dr
- 55 Edwards St
- 11 Freedom Dr
- 2 Freedom Dr
- 2 S Sulloway St
- 4 Freedom Dr
- 28 N Sulloway St
- 31 N Sulloway St
- 44 Edwards St
- 41 Edwards St
- 12 Freedom Dr
- 10 S Sulloway St
- 17 S Sulloway St
- 33 Edwards St
- 16 Freedom Dr
- 0 Rowell Dr
- 0 Rowell Dr Unit 5043422