Estimated Value: $427,027 - $447,000
2
Beds
2
Baths
1,140
Sq Ft
$384/Sq Ft
Est. Value
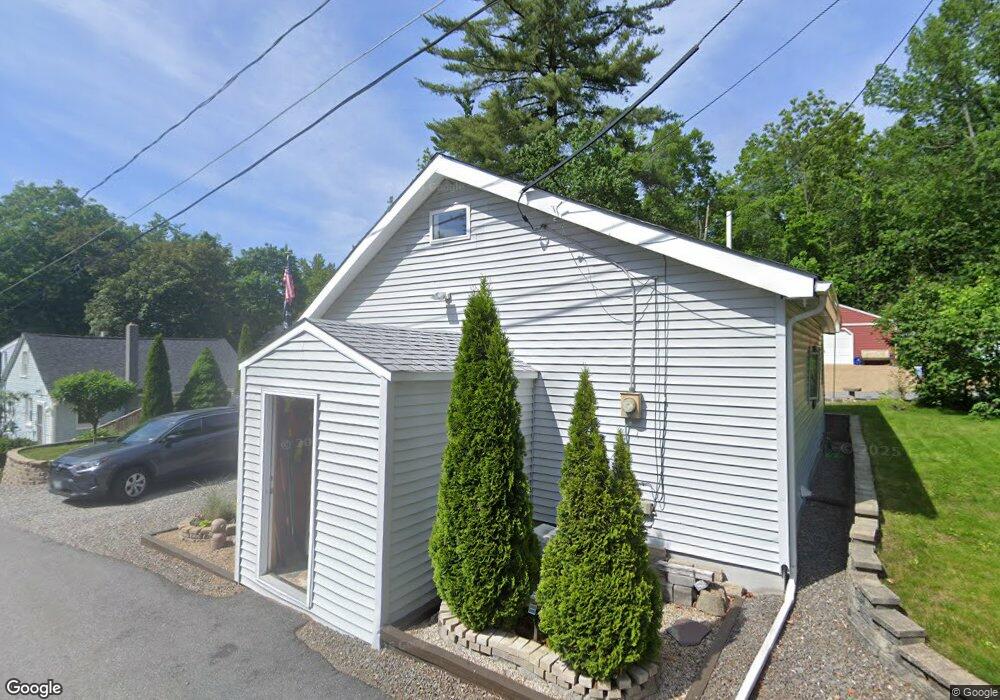
About This Home
This home is located at 2 Pebble Ln, Derry, NH 03038 and is currently estimated at $437,507, approximately $383 per square foot. 2 Pebble Ln is a home located in Rockingham County with nearby schools including Derry Village School, West Running Brook Middle School, and Pinkerton Academy.
Ownership History
Date
Name
Owned For
Owner Type
Purchase Details
Closed on
Sep 1, 2006
Sold by
Edmunds James R
Bought by
Cockroft David W
Current Estimated Value
Home Financials for this Owner
Home Financials are based on the most recent Mortgage that was taken out on this home.
Original Mortgage
$140,000
Outstanding Balance
$82,617
Interest Rate
6.83%
Mortgage Type
Purchase Money Mortgage
Estimated Equity
$354,890
Purchase Details
Closed on
Jul 5, 2000
Sold by
Jalbert Cheryl A
Bought by
Edmonds James R
Home Financials for this Owner
Home Financials are based on the most recent Mortgage that was taken out on this home.
Original Mortgage
$119,950
Interest Rate
8.55%
Purchase Details
Closed on
Jul 13, 1998
Sold by
Speers Geoffrey C and Speers Renee
Bought by
Jalbert Cheryl A
Home Financials for this Owner
Home Financials are based on the most recent Mortgage that was taken out on this home.
Original Mortgage
$81,493
Interest Rate
7.02%
Create a Home Valuation Report for This Property
The Home Valuation Report is an in-depth analysis detailing your home's value as well as a comparison with similar homes in the area
Home Values in the Area
Average Home Value in this Area
Purchase History
| Date | Buyer | Sale Price | Title Company |
|---|---|---|---|
| Cockroft David W | $180,000 | -- | |
| Edmonds James R | $123,500 | -- | |
| Jalbert Cheryl A | $85,000 | -- |
Source: Public Records
Mortgage History
| Date | Status | Borrower | Loan Amount |
|---|---|---|---|
| Open | Jalbert Cheryl A | $140,000 | |
| Previous Owner | Jalbert Cheryl A | $119,950 | |
| Previous Owner | Jalbert Cheryl A | $81,493 |
Source: Public Records
Tax History
| Year | Tax Paid | Tax Assessment Tax Assessment Total Assessment is a certain percentage of the fair market value that is determined by local assessors to be the total taxable value of land and additions on the property. | Land | Improvement |
|---|---|---|---|---|
| 2025 | $7,552 | $397,700 | $201,800 | $195,900 |
| 2024 | $7,433 | $397,700 | $201,800 | $195,900 |
| 2023 | $7,135 | $345,000 | $171,500 | $173,500 |
| 2022 | $6,569 | $345,000 | $171,500 | $173,500 |
| 2021 | $6,296 | $254,300 | $125,500 | $128,800 |
| 2020 | $7,347 | $254,300 | $125,500 | $128,800 |
| 2019 | $6,981 | $215,900 | $102,300 | $113,600 |
| 2018 | $5,550 | $215,900 | $102,300 | $113,600 |
| 2017 | $5,382 | $186,500 | $89,000 | $97,500 |
| 2016 | $5,047 | $186,500 | $89,000 | $97,500 |
| 2015 | $5,104 | $174,600 | $89,000 | $85,600 |
| 2014 | $5,137 | $174,600 | $89,000 | $85,600 |
| 2013 | $4,651 | $147,700 | $80,100 | $67,600 |
Source: Public Records
Map
Nearby Homes
- 29 Beaver Lake Ave
- 15 Bonnie Ln Unit R
- 3 Bonnie Ln
- 18 N Shore Rd
- 1 Grandview Ave
- 76 Tsienneto Rd
- 32 Chester Rd
- 7 Birchwood Dr
- 4 Pembroke Dr Unit 22
- 12 Halls Village Rd
- 5 Silvestri Cir Unit 20
- 9 Barkland Dr
- 7 Chester Rd Unit 212
- 47 Drew Woods Dr
- 89 Lane Rd
- 5 Nesmith St
- 15 Newells Meadow Ln
- 5 Tsienneto Rd Unit 47
- 5 Tsienneto Rd Unit 136
- 144 Rockingham Rd
Your Personal Tour Guide
Ask me questions while you tour the home.