Estimated Value: $349,392 - $360,000
2
Beds
2
Baths
1,140
Sq Ft
$311/Sq Ft
Est. Value
About This Home
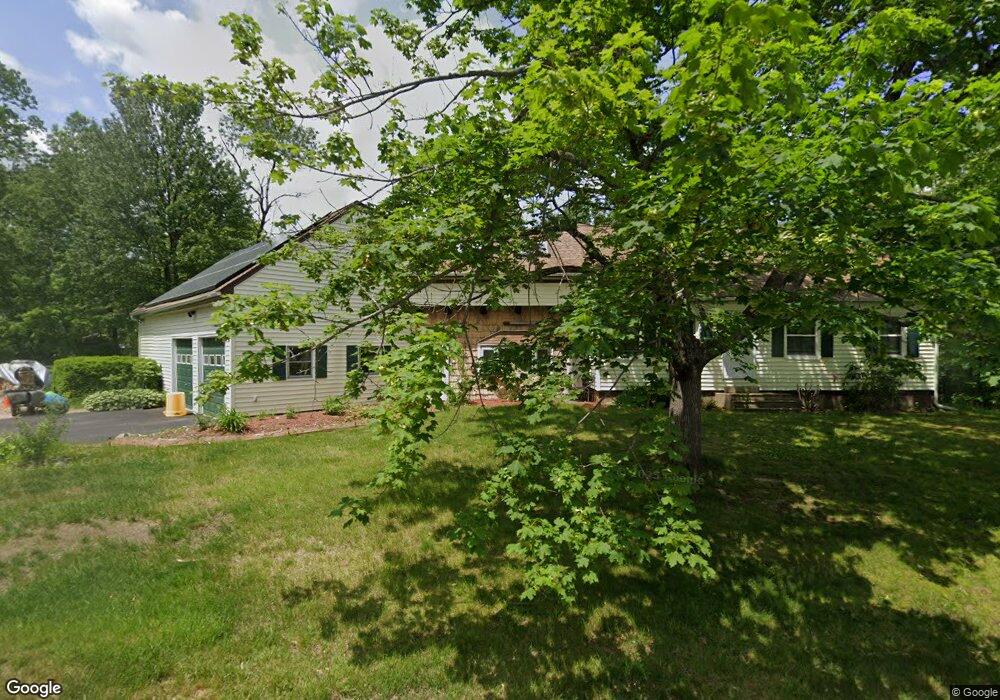
This home is located at 2 Pine St Unit E, Derry, NH 03038 and is currently estimated at $355,098, approximately $311 per square foot. 2 Pine St Unit E is a home located in Rockingham County with nearby schools including Ernest P. Barka Elementary School, Gilbert H. Hood Middle School, and Pinkerton Academy.
Ownership History
Date
Name
Owned For
Owner Type
Purchase Details
Closed on
Nov 25, 2014
Sold by
Renaud Keith and Renaud Jenna
Bought by
John A & G L Haga Ret
Current Estimated Value
Purchase Details
Closed on
Feb 3, 2014
Sold by
Haga John and Haga Gretchen
Bought by
John A Haga Ret and Haga
Purchase Details
Closed on
Oct 27, 2010
Sold by
Ira Steven E Leboeuf
Bought by
Renaud Keith and Mello Jenna
Home Financials for this Owner
Home Financials are based on the most recent Mortgage that was taken out on this home.
Original Mortgage
$116,565
Interest Rate
4.39%
Mortgage Type
Purchase Money Mortgage
Purchase Details
Closed on
May 26, 2010
Sold by
Department Of Housing & Urban Dev
Bought by
Roth Steven F Leboeuf and Equity Trust Co Custod
Purchase Details
Closed on
Aug 26, 2005
Sold by
Russell Shannon G
Bought by
Cook Ralph W and Cook Margaret M
Create a Home Valuation Report for This Property
The Home Valuation Report is an in-depth analysis detailing your home's value as well as a comparison with similar homes in the area
Home Values in the Area
Average Home Value in this Area
Purchase History
| Date | Buyer | Sale Price | Title Company |
|---|---|---|---|
| John A & G L Haga Ret | $140,000 | -- | |
| John A & G L Haga Ret | $140,000 | -- | |
| John A Haga Ret | -- | -- | |
| John A Haga Ret | -- | -- | |
| Renaud Keith | $122,000 | -- | |
| Renaud Keith | $122,000 | -- | |
| Roth Steven F Leboeuf | $40,000 | -- | |
| Steven F Leboeuf Roth | $40,000 | -- | |
| Cook Ralph W | $190,000 | -- | |
| Cook Ralph W | $190,000 | -- |
Source: Public Records
Mortgage History
| Date | Status | Borrower | Loan Amount |
|---|---|---|---|
| Previous Owner | Cook Ralph W | $116,565 |
Source: Public Records
Tax History
| Year | Tax Paid | Tax Assessment Tax Assessment Total Assessment is a certain percentage of the fair market value that is determined by local assessors to be the total taxable value of land and additions on the property. | Land | Improvement |
|---|---|---|---|---|
| 2025 | $6,003 | $316,100 | $0 | $316,100 |
| 2024 | $5,893 | $315,300 | $0 | $315,300 |
| 2023 | $5,273 | $255,000 | $0 | $255,000 |
| 2022 | $4,855 | $255,000 | $0 | $255,000 |
| 2021 | $4,613 | $186,300 | $0 | $186,300 |
| 2020 | $4,535 | $186,300 | $0 | $186,300 |
| 2019 | $3,793 | $145,200 | $40,000 | $105,200 |
| 2018 | $3,780 | $145,200 | $40,000 | $105,200 |
| 2017 | $3,997 | $138,500 | $40,000 | $98,500 |
| 2016 | $3,748 | $138,500 | $40,000 | $98,500 |
| 2015 | $3,911 | $133,800 | $40,000 | $93,800 |
| 2014 | $3,936 | $133,800 | $40,000 | $93,800 |
| 2013 | $2,510 | $79,700 | $30,000 | $49,700 |
Source: Public Records
Map
Nearby Homes
- 23R Pingree Hill Rd
- 32 Gypsum Ln Unit 30
- 34 Gypsum Ln Unit 31
- 18 N Shore Rd
- 11 Pingree Hill Rd Unit L
- 76 Tsienneto Rd
- 29 Beaver Lake Ave
- 1 Grandview Ave
- 0 Jack Rd
- 7 Birchwood Dr
- 12 Halls Village Rd
- 6 Hilda Ave
- 8 Mark Ave
- 9 Barkland Dr
- 3 Bonnie Ln
- 49 Chester Rd
- 56 Daniel Rd
- 32 Chester Rd
- 4 Paul Ave
- 54 Daniel Rd
- 2 Pine St Unit F
- 2 Pine St Unit D
- 2 Pine St Unit C
- 2 Pine St Unit B
- 2 Pine St Unit A
- 2 Pine St
- 2 Pine St Unit C
- 2 Pine St
- 1 Pine St
- 4 Pine St Unit 4 F
- 4 Pine St Unit H
- 4 Pine St Unit G
- 4 Pine St Unit F
- 4 Pine St Unit E
- 4 Pine St Unit D
- 4 Pine St Unit C
- 4 Pine St Unit B
- 4 Pine St Unit A
- 4 Pine St
- 4 Pine St
Your Personal Tour Guide
Ask me questions while you tour the home.