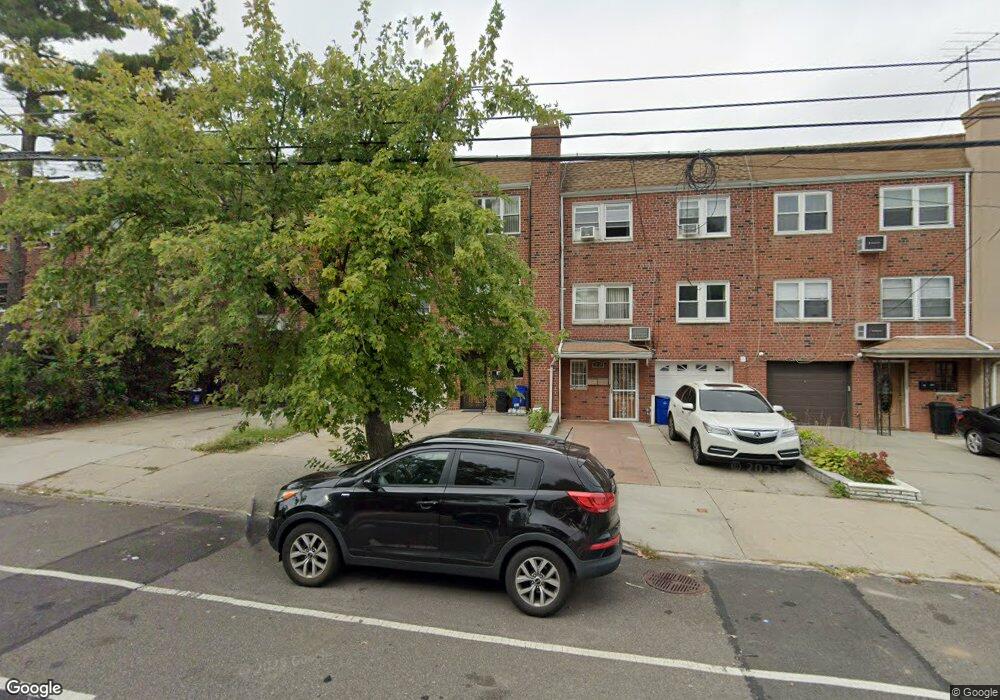
20-20 Utopia Pkwy Unit 3rd Fl Flushing, NY 11357
Clearview NeighborhoodEstimated Value: $1,452,000 - $1,601,000
3
Beds
2
Baths
1,100
Sq Ft
$1,391/Sq Ft
Est. Value
About This Home
This home is located at 20-20 Utopia Pkwy Unit 3rd Fl, Flushing, NY 11357 and is currently estimated at $1,530,461, approximately $1,391 per square foot. 20-20 Utopia Pkwy Unit 3rd Fl is a home located in Queens County with nearby schools including P.S. 184 Flushing Manor, J.H.S. 194 William Carr, and Bayside High School.
Ownership History
Date
Name
Owned For
Owner Type
Purchase Details
Closed on
Sep 7, 2023
Sold by
He Jian Yi and He Tianci
Bought by
He Tianci
Current Estimated Value
Purchase Details
Closed on
May 2, 2018
Sold by
Kim Song Jin
Bought by
He Jian Yi and He Tianci
Home Financials for this Owner
Home Financials are based on the most recent Mortgage that was taken out on this home.
Original Mortgage
$765,000
Outstanding Balance
$656,627
Interest Rate
4.45%
Mortgage Type
Purchase Money Mortgage
Estimated Equity
$873,834
Purchase Details
Closed on
Jul 31, 2001
Sold by
Boneta Joanne
Bought by
Kim Song Jin
Home Financials for this Owner
Home Financials are based on the most recent Mortgage that was taken out on this home.
Original Mortgage
$368,500
Interest Rate
6.98%
Mortgage Type
Purchase Money Mortgage
Purchase Details
Closed on
Aug 31, 1999
Sold by
Boneta Joanne and Estate Of Martin Franchina
Bought by
Boneta Joanne
Create a Home Valuation Report for This Property
The Home Valuation Report is an in-depth analysis detailing your home's value as well as a comparison with similar homes in the area
Home Values in the Area
Average Home Value in this Area
Purchase History
| Date | Buyer | Sale Price | Title Company |
|---|---|---|---|
| He Tianci | -- | -- | |
| He Tianci | -- | -- | |
| He Tianci | -- | -- | |
| He Jian Yi | $1,310,000 | -- | |
| He Jian Yi | $1,310,000 | -- | |
| He Jian Yi | $1,310,000 | -- | |
| Kim Song Jin | -- | -- | |
| Kim Song Jin | -- | -- | |
| Boneta Joanne | -- | Commonwealth Land Title Ins | |
| Boneta Joanne | -- | Commonwealth Land Title Ins |
Source: Public Records
Mortgage History
| Date | Status | Borrower | Loan Amount |
|---|---|---|---|
| Open | He Jian Yi | $765,000 | |
| Closed | He Jian Yi | $765,000 | |
| Previous Owner | Kim Song Jin | $368,500 |
Source: Public Records
Tax History
| Year | Tax Paid | Tax Assessment Tax Assessment Total Assessment is a certain percentage of the fair market value that is determined by local assessors to be the total taxable value of land and additions on the property. | Land | Improvement |
|---|---|---|---|---|
| 2025 | $12,794 | $65,491 | $9,245 | $56,246 |
| 2024 | $12,794 | $63,700 | $8,641 | $55,059 |
| 2023 | $12,324 | $61,361 | $7,432 | $53,929 |
| 2022 | $11,556 | $78,840 | $11,460 | $67,380 |
| 2021 | $12,174 | $79,320 | $11,460 | $67,860 |
| 2020 | $11,552 | $77,400 | $11,460 | $65,940 |
| 2019 | $11,104 | $66,300 | $11,460 | $54,840 |
| 2018 | $10,424 | $51,134 | $9,875 | $41,259 |
| 2017 | $9,834 | $48,240 | $9,961 | $38,279 |
| 2016 | $9,637 | $48,240 | $9,961 | $38,279 |
| 2015 | $5,269 | $45,480 | $12,505 | $32,975 |
| 2014 | $5,269 | $44,236 | $11,606 | $32,630 |
Source: Public Records
Map
Nearby Homes
- 20-19 Utopia Pkwy Unit 1-371
- 168-12 19th Ave
- 199-15 21 Ave Unit 1-356
- 199-05 21st Ave Unit 1st Floor
- 168-3 19th Ave Unit 3-181
- 18-06 169th St Unit 2Fl
- 19918 19th Ave Unit 18
- 19916 21st Ave Unit 1336
- 199-11 19th Ave Unit 2-170
- 17-83 166th St Unit Upper
- 166-23 20th Rd
- 168-11 18th Ave
- 21-29 Utopia Pkwy Unit UPSTAIRS
- 201-02 19th Ave Unit 2-142
- 21-47 Utopia Pkwy Unit 2
- 166-65 17th Rd
- 16662 22nd Ave
- 17-84 166 St Unit 4-162
- 199-07 17th Ave Unit 2-51
- 17-11 201st St
- 2020 Utopia Pkwy
- 2022 Utopia Pkwy
- 2022 Utopia Pkwy Unit 2nd Fl
- 2022 Utopia Pkwy Unit 2
- 20-18 Utopia Pkwy Unit 3Fl
- 2018 Utopia Pkwy
- 2024 Utopia Pkwy
- 2024 Utopia Pkwy Unit 3Fl
- 2024 Utopia Pkwy
- 2024 Utopia Pkwy Unit 3
- 2016 Utopia Pkwy
- 2026 Utopia Pkwy
- 20-14 Utopia Pkwy
- 2014 Utopia Pkwy
- 2028 Utopia Pkwy Unit 3rd Fl
- 2028 Utopia Pkwy Unit 3Fl
- 2028 Utopia Pkwy
- 2028 Utopia Pkwy Unit 2nd Fl
- 2028 Utopia Pkwy
- 20-26 Utopia Pkwy Unit 1F
Your Personal Tour Guide
Ask me questions while you tour the home.