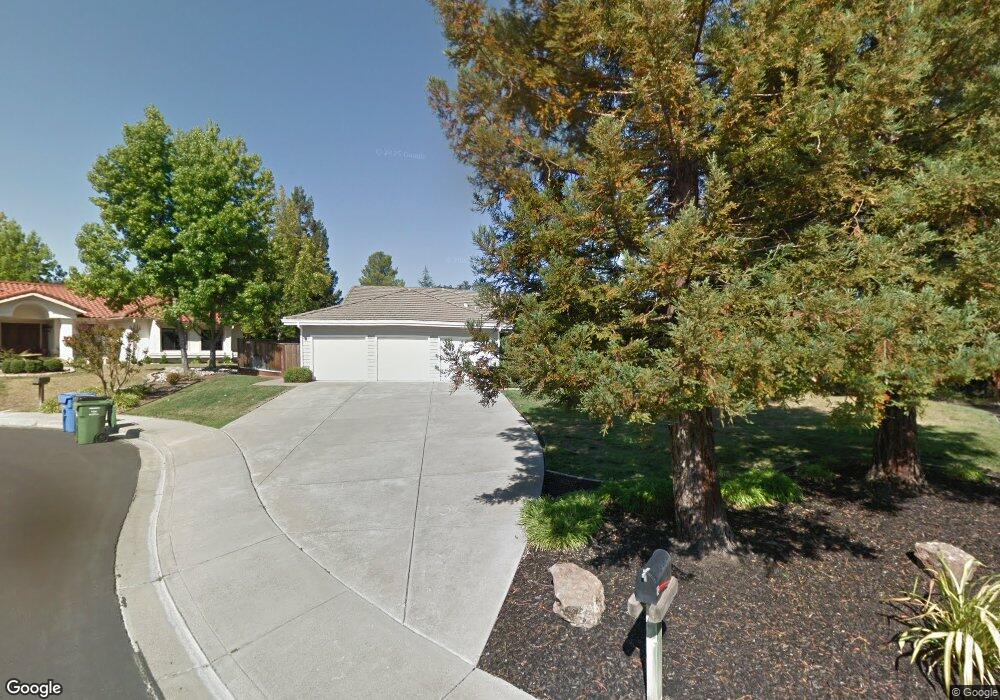
20 Hidden Crest Ct Danville, CA 94506
Sycamore Valley NeighborhoodEstimated Value: $2,212,000 - $2,564,000
4
Beds
2
Baths
2,710
Sq Ft
$873/Sq Ft
Est. Value
About This Home
This home is located at 20 Hidden Crest Ct, Danville, CA 94506 and is currently estimated at $2,365,828, approximately $872 per square foot. 20 Hidden Crest Ct is a home located in Contra Costa County with nearby schools including Sycamore Valley Elementary School, Charlotte Wood Middle School, and San Ramon Valley High School.
Ownership History
Date
Name
Owned For
Owner Type
Purchase Details
Closed on
Nov 19, 2013
Sold by
Pederson Andrew J and Pederson Melonie A
Bought by
Pederson Andrew J and Pederson Melonie A
Current Estimated Value
Home Financials for this Owner
Home Financials are based on the most recent Mortgage that was taken out on this home.
Original Mortgage
$795,000
Outstanding Balance
$591,693
Interest Rate
4.18%
Mortgage Type
New Conventional
Estimated Equity
$1,774,135
Purchase Details
Closed on
Sep 2, 2004
Sold by
Tam Samuel and Tam Annie R
Bought by
Pederson Andrew J and Pederson Melonie A
Home Financials for this Owner
Home Financials are based on the most recent Mortgage that was taken out on this home.
Original Mortgage
$824,800
Interest Rate
4.8%
Mortgage Type
Purchase Money Mortgage
Purchase Details
Closed on
Apr 5, 1994
Sold by
Tam Samuel and Tam Annie R
Bought by
Tam Samuel and Tam Annie R
Create a Home Valuation Report for This Property
The Home Valuation Report is an in-depth analysis detailing your home's value as well as a comparison with similar homes in the area
Home Values in the Area
Average Home Value in this Area
Purchase History
| Date | Buyer | Sale Price | Title Company |
|---|---|---|---|
| Pederson Andrew J | -- | Accommodation | |
| Pederson Andrew J | -- | Fidelity National Title Co | |
| Pederson Andrew J | $1,031,000 | Chicago Title | |
| Tam Samuel | -- | American Title Insurance Co |
Source: Public Records
Mortgage History
| Date | Status | Borrower | Loan Amount |
|---|---|---|---|
| Open | Pederson Andrew J | $795,000 | |
| Closed | Pederson Andrew J | $824,800 |
Source: Public Records
Tax History Compared to Growth
Tax History
| Year | Tax Paid | Tax Assessment Tax Assessment Total Assessment is a certain percentage of the fair market value that is determined by local assessors to be the total taxable value of land and additions on the property. | Land | Improvement |
|---|---|---|---|---|
| 2025 | $18,752 | $1,624,984 | $833,553 | $791,431 |
| 2024 | $17,298 | $1,593,122 | $817,209 | $775,913 |
| 2023 | $17,298 | $1,455,023 | $801,186 | $653,837 |
| 2022 | $16,834 | $1,426,494 | $785,477 | $641,017 |
| 2021 | $16,481 | $1,398,525 | $770,076 | $628,449 |
| 2019 | $16,160 | $1,357,046 | $747,236 | $609,810 |
| 2018 | $15,566 | $1,330,438 | $732,585 | $597,853 |
| 2017 | $14,004 | $1,211,000 | $680,632 | $530,368 |
| 2016 | $13,622 | $1,167,000 | $655,901 | $511,099 |
| 2015 | $12,826 | $1,091,500 | $613,467 | $478,033 |
| 2014 | $11,067 | $925,500 | $520,169 | $405,331 |
Source: Public Records
Map
Nearby Homes
- 105 Creighton Way
- 422 Sutton Cir
- 134 Tivoli Ln
- 3652 Old Blackhawk Rd
- 314 W Meadows Ln
- 226 Promenade Ln
- 89 Amberfield Ln
- 6401 Camino Tassajara
- 140 Blackstone Dr
- 24 Timberview Ct
- 2120 Goldenrod Ln
- 132 Victoria Place
- 404 Regal Lily Ln
- 110 Bridgeside Cir
- 32 Maximo Ct
- 1000 Sunshine Cir
- 3466 Silver Maple Dr
- 60 Rainbow Cir
- 313 Camino Arroyo E
- 214 Bellflower Dr
- 30 Hidden Crest Ct
- 10 Hidden Crest Ct
- 45 Hidden Crest Ct
- 35 Hidden Crest Ct
- 25 Hidden Crest Ct
- 102 Julie Ct
- 106 Julie Ct
- 108 Julie Ct
- 110 Julie Ct
- 116 Julie Ct
- 120 Julie Ct
- 128 Julie Ct
- 60 Diablo View Ct
- 10 Windsor Ct
- 15 Hidden Crest Ct
- 5 Shady Oak Ct
- 20 Windsor Ct
- 15 Windsor Ct
- 50 Diablo View Ct
- 15 Shady Oak Ct