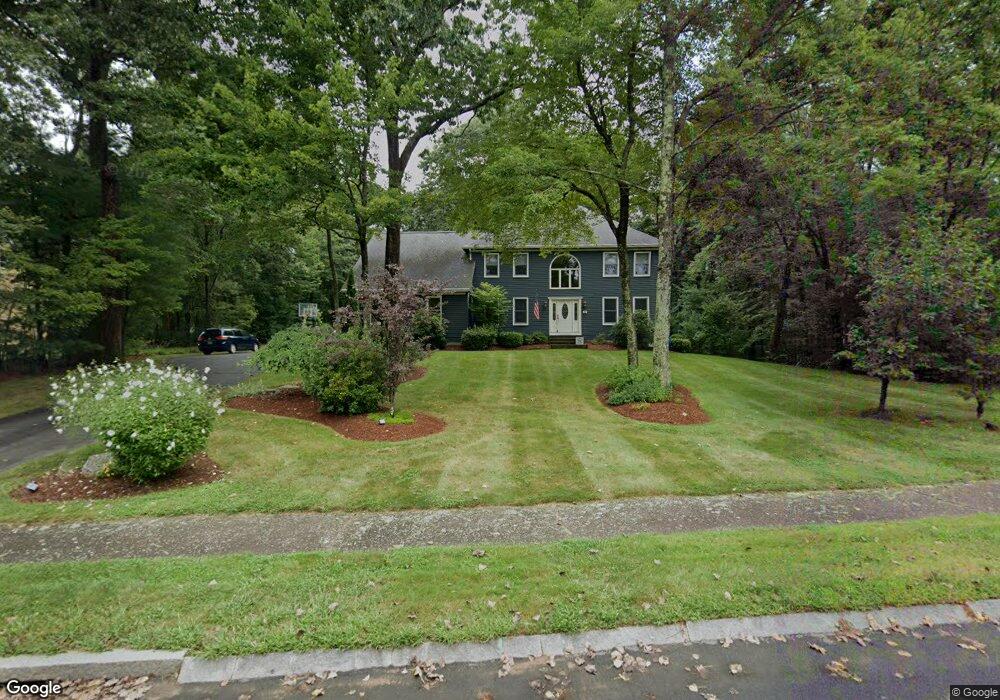
20 Jefferson Rd Franklin, MA 02038
Wadsworth NeighborhoodEstimated Value: $1,070,236 - $1,132,000
4
Beds
4
Baths
2,970
Sq Ft
$370/Sq Ft
Est. Value
About This Home
This home is located at 20 Jefferson Rd, Franklin, MA 02038 and is currently estimated at $1,098,559, approximately $369 per square foot. 20 Jefferson Rd is a home located in Norfolk County with nearby schools including Jefferson Elementary School, Remington Middle School, and Franklin High School.
Ownership History
Date
Name
Owned For
Owner Type
Purchase Details
Closed on
Apr 21, 2015
Sold by
Scharland Michael J and Scharland Holly M
Bought by
Schaland Ft and Scharland Michael J
Current Estimated Value
Purchase Details
Closed on
Apr 26, 2002
Sold by
Gildea David P and Gildea Lisa
Bought by
Scharland Michael J and Scharland Holly M
Purchase Details
Closed on
Jun 15, 1994
Sold by
Jc Builders Inc
Bought by
Gildea David P and Gildea Lisa
Create a Home Valuation Report for This Property
The Home Valuation Report is an in-depth analysis detailing your home's value as well as a comparison with similar homes in the area
Home Values in the Area
Average Home Value in this Area
Purchase History
| Date | Buyer | Sale Price | Title Company |
|---|---|---|---|
| Schaland Ft | -- | -- | |
| Scharland Michael J | $505,000 | -- | |
| Gildea David P | $257,000 | -- |
Source: Public Records
Mortgage History
| Date | Status | Borrower | Loan Amount |
|---|---|---|---|
| Previous Owner | Gildea David P | $373,000 | |
| Previous Owner | Gildea David P | $300,000 | |
| Previous Owner | Gildea David P | $150,000 |
Source: Public Records
Tax History Compared to Growth
Tax History
| Year | Tax Paid | Tax Assessment Tax Assessment Total Assessment is a certain percentage of the fair market value that is determined by local assessors to be the total taxable value of land and additions on the property. | Land | Improvement |
|---|---|---|---|---|
| 2025 | $10,782 | $927,900 | $380,800 | $547,100 |
| 2024 | $11,109 | $942,200 | $380,800 | $561,400 |
| 2023 | $10,228 | $813,000 | $323,500 | $489,500 |
| 2022 | $10,830 | $770,800 | $337,000 | $433,800 |
| 2021 | $9,772 | $667,000 | $282,600 | $384,400 |
| 2020 | $9,417 | $649,000 | $282,600 | $366,400 |
| 2019 | $9,470 | $646,000 | $279,700 | $366,300 |
| 2018 | $9,023 | $615,900 | $285,500 | $330,400 |
| 2017 | $9,110 | $624,800 | $294,400 | $330,400 |
| 2016 | $8,646 | $596,300 | $270,000 | $326,300 |
| 2015 | $8,112 | $546,600 | $220,300 | $326,300 |
| 2014 | $8,137 | $563,100 | $236,800 | $326,300 |
Source: Public Records
Map
Nearby Homes