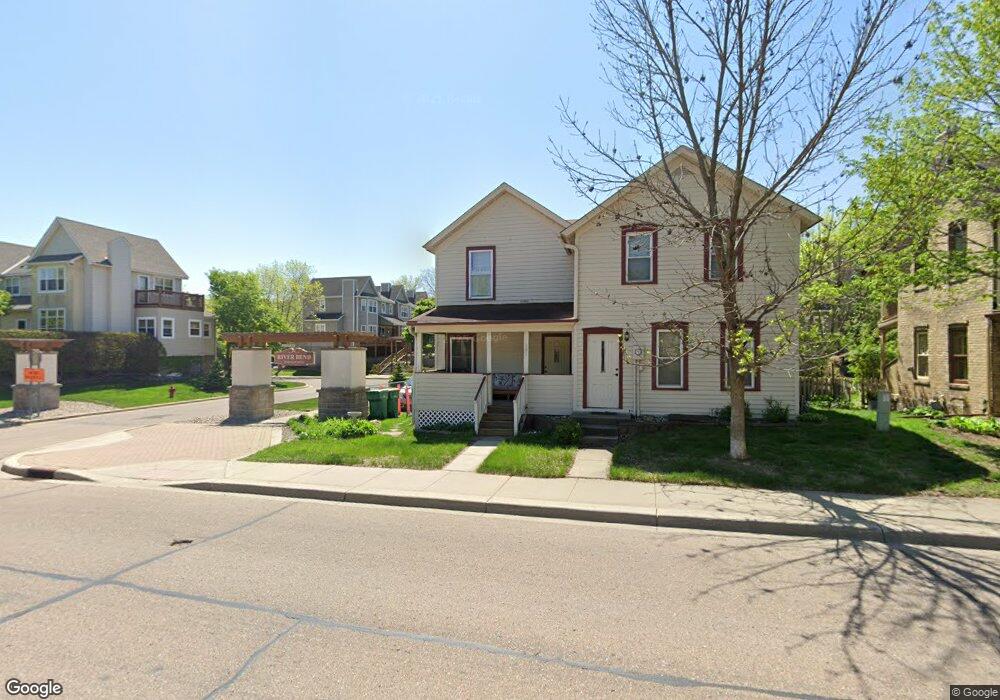
20 River Bend Place Chaska, MN 55318
Estimated Value: $270,277 - $287,000
3
Beds
2
Baths
1,392
Sq Ft
$201/Sq Ft
Est. Value
About This Home
This home is located at 20 River Bend Place, Chaska, MN 55318 and is currently estimated at $280,069, approximately $201 per square foot. 20 River Bend Place is a home located in Carver County with nearby schools including Carver Elementary School, Pioneer Ridge Middle School, and Chaska High School.
Ownership History
Date
Name
Owned For
Owner Type
Purchase Details
Closed on
Aug 17, 2018
Sold by
Jensen Christos R and Jacobsen Melissa J
Bought by
Adair Dawn
Current Estimated Value
Home Financials for this Owner
Home Financials are based on the most recent Mortgage that was taken out on this home.
Original Mortgage
$170,000
Outstanding Balance
$147,960
Interest Rate
4.6%
Mortgage Type
New Conventional
Estimated Equity
$132,109
Purchase Details
Closed on
Jun 6, 2008
Sold by
Wiedeke Brian and Anderson Teri
Bought by
Jacobsen Melissa J
Home Financials for this Owner
Home Financials are based on the most recent Mortgage that was taken out on this home.
Original Mortgage
$163,800
Interest Rate
6.04%
Mortgage Type
New Conventional
Purchase Details
Closed on
Jul 8, 2004
Sold by
Marier Kathleen C
Bought by
Wiedeke Brian and Anderson Teri
Purchase Details
Closed on
May 22, 2000
Sold by
Turner Paul G and Turner Sonia L
Bought by
Marier Kathleen C
Create a Home Valuation Report for This Property
The Home Valuation Report is an in-depth analysis detailing your home's value as well as a comparison with similar homes in the area
Home Values in the Area
Average Home Value in this Area
Purchase History
| Date | Buyer | Sale Price | Title Company |
|---|---|---|---|
| Adair Dawn | $200,000 | Burnet Title | |
| Jacobsen Melissa J | $182,000 | -- | |
| Wiedeke Brian | $185,500 | -- | |
| Marier Kathleen C | $159,900 | -- |
Source: Public Records
Mortgage History
| Date | Status | Borrower | Loan Amount |
|---|---|---|---|
| Open | Adair Dawn | $170,000 | |
| Previous Owner | Jacobsen Melissa J | $163,800 |
Source: Public Records
Tax History
| Year | Tax Paid | Tax Assessment Tax Assessment Total Assessment is a certain percentage of the fair market value that is determined by local assessors to be the total taxable value of land and additions on the property. | Land | Improvement |
|---|---|---|---|---|
| 2025 | $2,776 | $250,200 | $57,000 | $193,200 |
| 2024 | $2,778 | $250,200 | $57,000 | $193,200 |
| 2023 | $2,650 | $248,200 | $57,000 | $191,200 |
| 2022 | $2,396 | $282,500 | $50,200 | $232,300 |
| 2021 | $2,186 | $196,200 | $41,800 | $154,400 |
| 2020 | $2,360 | $192,500 | $41,800 | $150,700 |
| 2019 | $2,306 | $179,400 | $39,800 | $139,600 |
| 2018 | $2,264 | $179,400 | $39,800 | $139,600 |
| 2017 | $2,154 | $174,400 | $39,800 | $134,600 |
| 2016 | $2,196 | $158,700 | $0 | $0 |
| 2015 | $2,078 | $148,300 | $0 | $0 |
| 2014 | $2,078 | $143,500 | $0 | $0 |
Source: Public Records
Map
Nearby Homes
- 215 N Walnut St
- 217 N Walnut St
- 213 N Walnut St
- 215 N Maple St
- 504 N Maple St
- 705 Ensconced Way
- 734 Ensconced Way
- 707 Ensconced Way
- 730 Ensconced Way
- 3753 Brookside Dr
- 3759 Brookside Dr
- 3749 Brookside Dr
- 755 Ensconced Way
- 759 Ensconced Way
- 3755 Brookside Dr
- 3771 Brookside Dr
- 3776 Brookside Dr
- 3780 Brookside Dr
- 887 Laurel Ct
- 3784 Brookside Dr
- 21 River Bend Place
- 19 River Bend Place
- 22 River Bend Place
- 13 River Bend Place
- 14 River Bend Place
- 12 River Bend Place
- 23 River Bend Place
- 15 River Bend Place
- 30 River Bend Place
- 29 River Bend Place
- 31 River Bend Place
- 28 River Bend Place
- 27 River Bend Place
- 10 River Bend Place
- 201 W 1st St
- 11 River Bend Place
- 205 205 1st-Street-w
- 18 River Bend Place
- 17 River Bend Place
- 24 River Bend Place
Your Personal Tour Guide
Ask me questions while you tour the home.