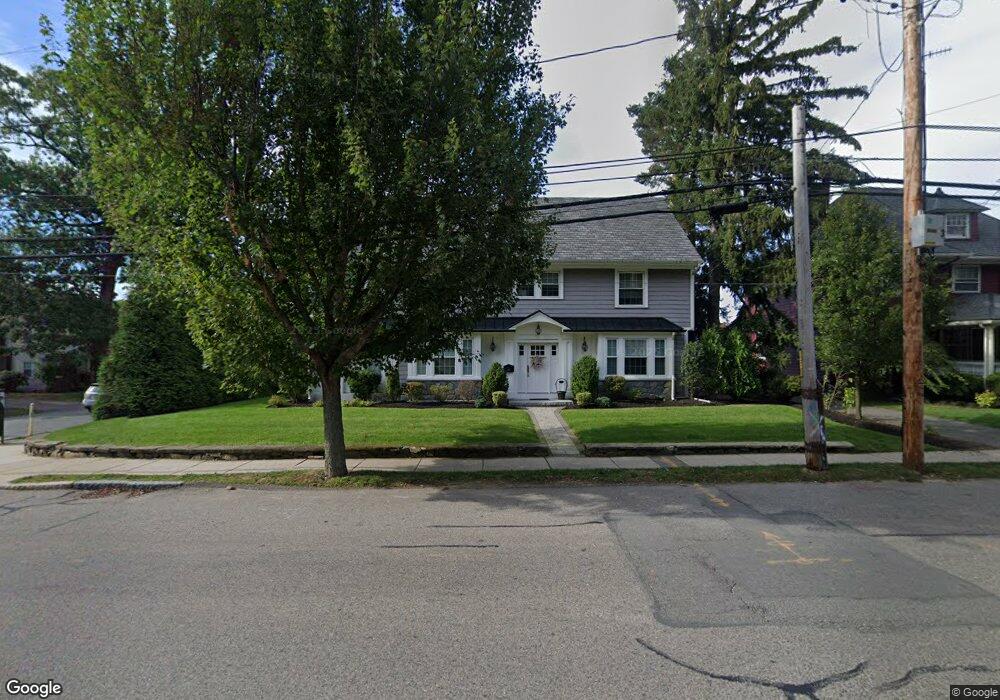
200 Edge Hill Rd Milton, MA 02186
Milton Hill NeighborhoodEstimated Value: $1,252,000 - $1,798,398
4
Beds
4
Baths
3,202
Sq Ft
$481/Sq Ft
Est. Value
About This Home
This home is located at 200 Edge Hill Rd, Milton, MA 02186 and is currently estimated at $1,539,600, approximately $480 per square foot. 200 Edge Hill Rd is a home located in Norfolk County with nearby schools including Milton High School, St. Agatha School, and Adams Montessori School.
Ownership History
Date
Name
Owned For
Owner Type
Purchase Details
Closed on
Jun 1, 2021
Sold by
Bamsam T
Bought by
Amaru Philip C
Current Estimated Value
Purchase Details
Closed on
Jan 8, 2020
Sold by
Amaru Philip C
Bought by
Bamsam T
Purchase Details
Closed on
Feb 21, 2018
Sold by
Amaru Rose
Bought by
Amaru Philip
Purchase Details
Closed on
May 1, 2017
Sold by
Amaru Rose
Bought by
Amaru Rose and Robertson Lillian A
Purchase Details
Closed on
Apr 20, 2017
Sold by
200 Edgehill Road Rt
Bought by
Amaru Rose
Create a Home Valuation Report for This Property
The Home Valuation Report is an in-depth analysis detailing your home's value as well as a comparison with similar homes in the area
Home Values in the Area
Average Home Value in this Area
Purchase History
| Date | Buyer | Sale Price | Title Company |
|---|---|---|---|
| Amaru Philip C | -- | None Available | |
| Bamsam T | -- | None Available | |
| Amaru Philip | $67,300 | -- | |
| Amaru Philip C | -- | -- | |
| Amaru Rose | -- | -- | |
| Amaru Rose | -- | -- |
Source: Public Records
Tax History Compared to Growth
Tax History
| Year | Tax Paid | Tax Assessment Tax Assessment Total Assessment is a certain percentage of the fair market value that is determined by local assessors to be the total taxable value of land and additions on the property. | Land | Improvement |
|---|---|---|---|---|
| 2025 | $17,430 | $1,571,700 | $517,800 | $1,053,900 |
| 2024 | $16,893 | $1,547,000 | $493,100 | $1,053,900 |
| 2023 | $16,006 | $1,404,000 | $469,700 | $934,300 |
| 2022 | $14,918 | $1,196,300 | $469,700 | $726,600 |
| 2021 | $14,562 | $1,109,100 | $417,100 | $692,000 |
| 2020 | $14,309 | $1,090,600 | $409,300 | $681,300 |
| 2019 | $10,582 | $802,900 | $397,400 | $405,500 |
| 2018 | $10,512 | $761,200 | $362,000 | $399,200 |
| 2017 | $9,839 | $725,600 | $344,700 | $380,900 |
| 2016 | $9,104 | $674,400 | $301,600 | $372,800 |
| 2015 | $8,841 | $634,200 | $280,100 | $354,100 |
Source: Public Records
Map
Nearby Homes
- 46 Century Ln
- 639 Pleasant St Unit 639
- 639 Pleasant St
- 397 Adams St
- 400 Adams St Unit A
- 400 Adams St Unit B
- 418 Pleasant St
- 71 Cabot St
- 461 Centre St
- 55 Christopher Dr
- 64 Shawmut St
- 60 Pond St
- 66 Unity St
- 41 Wallace Rd
- 111 Shawmut St
- 51 Denmark Ave
- 11 Rockwell Ave
- 29 Oconnell Ave
- 171 Milton St
- 795 Brook Rd
- 202 Edge Hill Rd
- 199 Edge Hill Rd
- 190 Edge Hill Rd
- 208 Edge Hill Rd
- 132 Otis St
- 205 Edge Hill Rd
- 214 Edge Hill Rd
- 5 Westbourne St
- 191 Edge Hill Rd
- 137 Otis St
- 7 Westbourne St
- 131 Otis St
- 209 Edge Hill Rd
- 9 Westbourne St
- 14 Cedar Rd
- 184 Edge Hill Rd
- 218 Edge Hill Rd
- 99 Waldeck Rd
- 00 Waldeck Rd
- 4 Westbourne St