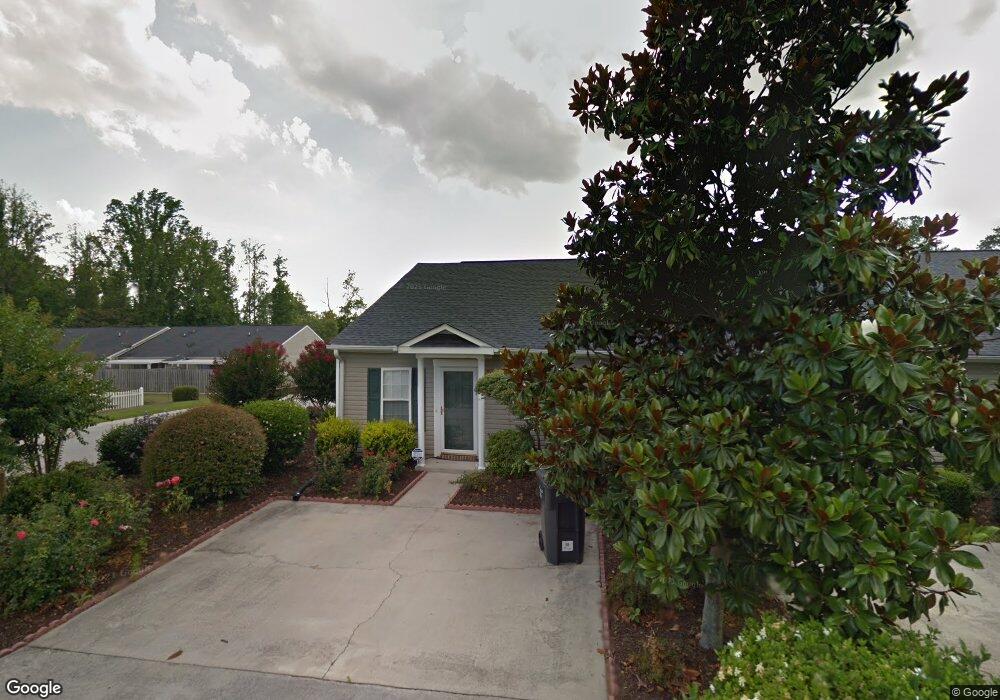
2001 Caton Dr Augusta, GA 30909
Belair NeighborhoodEstimated Value: $173,747 - $180,000
2
Beds
2
Baths
1,100
Sq Ft
$161/Sq Ft
Est. Value
About This Home
This home is located at 2001 Caton Dr, Augusta, GA 30909 and is currently estimated at $176,937, approximately $160 per square foot. 2001 Caton Dr is a home located in Richmond County with nearby schools including Sue Reynolds Elementary School, Johnson Magnet, and Academy of Richmond County High School.
Ownership History
Date
Name
Owned For
Owner Type
Purchase Details
Closed on
Aug 8, 2023
Sold by
Griffin Daniel
Bought by
American Flag Llc
Current Estimated Value
Purchase Details
Closed on
May 19, 2003
Sold by
Kinney Michael J
Bought by
Delaney Bok Im
Home Financials for this Owner
Home Financials are based on the most recent Mortgage that was taken out on this home.
Original Mortgage
$55,200
Interest Rate
5.79%
Mortgage Type
Purchase Money Mortgage
Purchase Details
Closed on
Dec 5, 2001
Sold by
First Union National Bank
Bought by
St Kitts Llc
Home Financials for this Owner
Home Financials are based on the most recent Mortgage that was taken out on this home.
Original Mortgage
$49,520
Interest Rate
6.6%
Purchase Details
Closed on
Nov 29, 2001
Sold by
St Kitts Llc
Bought by
Kinney Michael J
Home Financials for this Owner
Home Financials are based on the most recent Mortgage that was taken out on this home.
Original Mortgage
$49,520
Interest Rate
6.6%
Purchase Details
Closed on
Nov 26, 2001
Sold by
Tca Llc
Bought by
St Kitt'S Llc
Home Financials for this Owner
Home Financials are based on the most recent Mortgage that was taken out on this home.
Original Mortgage
$49,520
Interest Rate
6.6%
Purchase Details
Closed on
Jul 6, 2001
Sold by
Tca Llc
Bought by
St Kitt'S Llc
Create a Home Valuation Report for This Property
The Home Valuation Report is an in-depth analysis detailing your home's value as well as a comparison with similar homes in the area
Home Values in the Area
Average Home Value in this Area
Purchase History
| Date | Buyer | Sale Price | Title Company |
|---|---|---|---|
| American Flag Llc | -- | -- | |
| Griffin Daniel | -- | -- | |
| Delaney Bok Im | $69,000 | -- | |
| St Kitts Llc | -- | -- | |
| Kinney Michael J | $61,900 | -- | |
| St Kitt'S Llc | $1,200,000 | -- | |
| St Kitt'S Llc | $123,600 | -- |
Source: Public Records
Mortgage History
| Date | Status | Borrower | Loan Amount |
|---|---|---|---|
| Previous Owner | Delaney Bok Im | $55,200 | |
| Previous Owner | Kinney Michael J | $49,520 |
Source: Public Records
Tax History
| Year | Tax Paid | Tax Assessment Tax Assessment Total Assessment is a certain percentage of the fair market value that is determined by local assessors to be the total taxable value of land and additions on the property. | Land | Improvement |
|---|---|---|---|---|
| 2025 | $2,296 | $69,804 | $10,800 | $59,004 |
| 2024 | $2,296 | $66,644 | $10,800 | $55,844 |
| 2023 | $2,101 | $67,484 | $10,800 | $56,684 |
| 2022 | $1,729 | $50,636 | $10,800 | $39,836 |
| 2021 | $1,517 | $39,241 | $8,400 | $30,841 |
| 2020 | $1,494 | $39,241 | $8,400 | $30,841 |
| 2019 | $1,350 | $32,124 | $8,400 | $23,724 |
| 2018 | $1,359 | $32,124 | $8,400 | $23,724 |
| 2017 | $1,353 | $32,124 | $8,400 | $23,724 |
| 2016 | $1,354 | $32,124 | $8,400 | $23,724 |
| 2015 | $1,362 | $32,124 | $8,400 | $23,724 |
| 2014 | $1,347 | $31,620 | $8,400 | $23,220 |
Source: Public Records
Map
Nearby Homes
- 3035 Abba Dr
- 4031 Calypso Dr
- 107 Barts Dr
- 8035 Reagan Cir
- 130 Barts Dr
- 300 Nevis Dr
- 5026 Wheeler Lake Rd
- 308 Nevis Dr
- 5034 Wheeler Lake Rd
- 1729 Elizabeth St
- 2506 Larchmont Ct
- 2622 Chaucer Dr
- 3018 Hillcreek Dr
- 2949 Hillcreek Dr
- 2210 Larks Ct
- 5117 Wheeler Lake Rd
- 1215 Brookstone Way
- 5249 Aruba Cir
- 1101 Brookstone Way
- 1404 Feldspar Ct
Your Personal Tour Guide
Ask me questions while you tour the home.