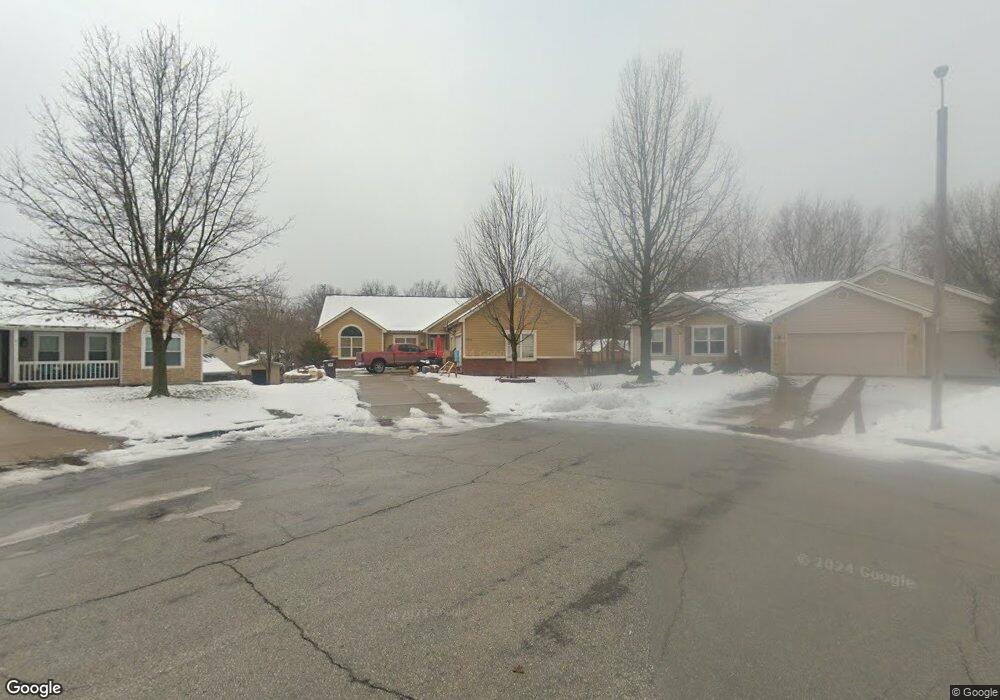
2003 E 26th St Lawrence, KS 66046
Prairie Park NeighborhoodEstimated Value: $396,000 - $429,000
5
Beds
3
Baths
2,050
Sq Ft
$200/Sq Ft
Est. Value
About This Home
This home is located at 2003 E 26th St, Lawrence, KS 66046 and is currently estimated at $410,547, approximately $200 per square foot. 2003 E 26th St is a home located in Douglas County with nearby schools including Prairie Park Elementary School, Billy Mills Middle School, and Lawrence High School.
Ownership History
Date
Name
Owned For
Owner Type
Purchase Details
Closed on
May 27, 2020
Sold by
Jones Stanley Alan and Jones Barbara Bosley
Bought by
Jones Stanley A and Jones Barbara B
Current Estimated Value
Home Financials for this Owner
Home Financials are based on the most recent Mortgage that was taken out on this home.
Original Mortgage
$187,000
Interest Rate
3.3%
Mortgage Type
New Conventional
Purchase Details
Closed on
Aug 28, 2001
Sold by
Jones Adrian D and Jones Tammie L
Bought by
Jones Adrian D and Jones Tammie L
Home Financials for this Owner
Home Financials are based on the most recent Mortgage that was taken out on this home.
Original Mortgage
$150,000
Interest Rate
7.07%
Mortgage Type
Purchase Money Mortgage
Create a Home Valuation Report for This Property
The Home Valuation Report is an in-depth analysis detailing your home's value as well as a comparison with similar homes in the area
Home Values in the Area
Average Home Value in this Area
Purchase History
| Date | Buyer | Sale Price | Title Company |
|---|---|---|---|
| Jones Stanley A | -- | None Available | |
| Jones Adrian D | -- | Commerce Title |
Source: Public Records
Mortgage History
| Date | Status | Borrower | Loan Amount |
|---|---|---|---|
| Closed | Jones Stanley A | $187,000 | |
| Closed | Jones Adrian D | $150,000 |
Source: Public Records
Tax History
| Year | Tax Paid | Tax Assessment Tax Assessment Total Assessment is a certain percentage of the fair market value that is determined by local assessors to be the total taxable value of land and additions on the property. | Land | Improvement |
|---|---|---|---|---|
| 2025 | $5,918 | $47,495 | $8,050 | $39,445 |
| 2024 | $5,617 | $45,126 | $7,475 | $37,651 |
| 2023 | $5,235 | $40,664 | $6,900 | $33,764 |
| 2022 | $4,750 | $36,685 | $6,325 | $30,360 |
| 2021 | $4,415 | $33,036 | $5,175 | $27,861 |
| 2020 | $4,142 | $31,166 | $5,175 | $25,991 |
| 2019 | $3,938 | $29,681 | $4,947 | $24,734 |
| 2018 | $3,918 | $29,314 | $4,720 | $24,594 |
| 2017 | $3,845 | $28,451 | $4,720 | $23,731 |
| 2016 | $3,597 | $27,819 | $4,600 | $23,219 |
| 2015 | -- | $26,623 | $4,600 | $22,023 |
| 2014 | -- | $26,669 | $4,600 | $22,069 |
Source: Public Records
Map
Nearby Homes
- 2604 Mayfair Dr
- 1909 E 25th Terrace
- 2132 E 26th St
- 2343 Surrey Dr
- 2502 E 27th Terrace
- 2912 Lankford Dr
- 2917 Lankford Dr
- 2512 Marcia Ln
- 2531 Arlene Place
- 1729 Whitmore Ct
- 2529 Arlene Place
- 2705 Chasehire Dr
- 2004 Goodell Ct
- 2727 Rawhide Ln
- 2123 Goodell Ct
- 2628 E 26th Ct
- 1605 E 21st Place
- 1708 E 21st Terrace
- 2725 Ponderosa Dr
- 2014 Maple Ln
- 2007 E 26th St
- 2000 E 26th St
- 2612 Kensington Rd
- 2006 E 26th Terrace
- 2608 Kensington Rd
- 2616 Kensington Rd
- 2011 E 26th St
- 2010 E 26th Terrace
- 2002 E 26th Terrace
- 2604 Kensington Rd
- 2004 E 26th St
- 2620 Kensington Rd
- 2014 E 26th Terrace
- 2015 E 26th St
- 2008 E 26th St
- 2600 Kensington Rd
- 2012 E 26th St
- 2624 Kensington Rd
- 2609 Kensington Rd
- 2613 Kensington Rd
Your Personal Tour Guide
Ask me questions while you tour the home.