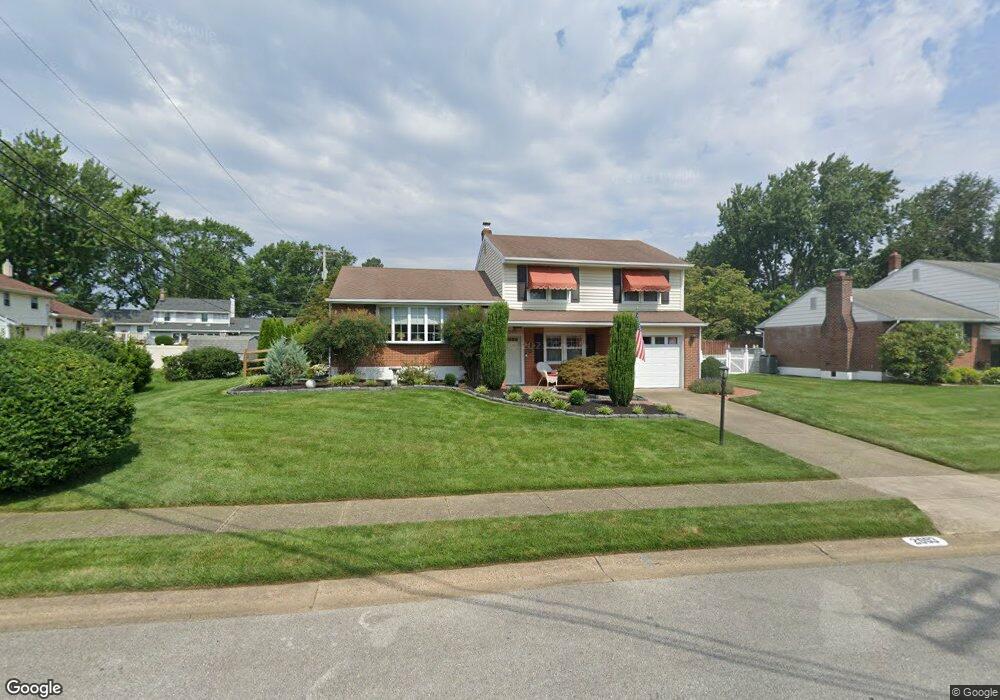
2003 Gravers Ln Wilmington, DE 19810
Estimated Value: $437,000 - $508,000
3
Beds
2
Baths
1,406
Sq Ft
$337/Sq Ft
Est. Value
About This Home
This home is located at 2003 Gravers Ln, Wilmington, DE 19810 and is currently estimated at $473,246, approximately $336 per square foot. 2003 Gravers Ln is a home located in New Castle County with nearby schools including Forwood Elementary School, Talley Middle School, and Brandywine High School.
Ownership History
Date
Name
Owned For
Owner Type
Purchase Details
Closed on
Mar 7, 2019
Sold by
Bye Mary C
Bought by
Bye Mary C and Bye Robert
Current Estimated Value
Purchase Details
Closed on
Oct 13, 1989
Bought by
Bye Mary C
Create a Home Valuation Report for This Property
The Home Valuation Report is an in-depth analysis detailing your home's value as well as a comparison with similar homes in the area
Home Values in the Area
Average Home Value in this Area
Purchase History
| Date | Buyer | Sale Price | Title Company |
|---|---|---|---|
| Bye Mary C | -- | None Available | |
| Bye Mary C | -- | -- | |
| Bye Mary C | -- | -- |
Source: Public Records
Tax History
| Year | Tax Paid | Tax Assessment Tax Assessment Total Assessment is a certain percentage of the fair market value that is determined by local assessors to be the total taxable value of land and additions on the property. | Land | Improvement |
|---|---|---|---|---|
| 2024 | $1,075 | $77,300 | $13,700 | $63,600 |
| 2023 | $934 | $77,300 | $13,700 | $63,600 |
| 2022 | $954 | $77,300 | $13,700 | $63,600 |
| 2021 | $1,053 | $77,300 | $13,700 | $63,600 |
| 2020 | $1,054 | $77,300 | $13,700 | $63,600 |
| 2019 | $1,088 | $77,300 | $13,700 | $63,600 |
| 2018 | $992 | $77,300 | $13,700 | $63,600 |
| 2017 | $977 | $77,300 | $13,700 | $63,600 |
| 2016 | $876 | $77,300 | $13,700 | $63,600 |
| 2015 | $762 | $77,300 | $13,700 | $63,600 |
| 2014 | $560 | $67,100 | $13,700 | $53,400 |
Source: Public Records
Map
Nearby Homes
- 2414 Caney Rd
- 2247 Silverside Rd
- 113 Scotts Way
- 2227 Grubb Rd
- 1822 Foulk Rd
- 2115 Coventry Dr
- 2431 Grubb Rd
- 2433 Grubb Rd
- 1207 Windon Dr
- 2218 Marsh Rd
- 1 Penarth Dr
- 1900 Old Wood Rd
- 9 Penarth Dr
- 2412 Chatham Dr
- 1900 Beechwood Dr
- 1415 Windybush Rd
- 1112 Faun Rd
- 2336 Taggart Ct Unit 336T
- 133 Marcella Rd
- 2003 Dogwood Ln
- 2005 Gravers Ln
- 2001 Gravers Ln
- 2303 Matwood Rd
- 2002 Floral Dr
- 2004 Floral Dr
- 2007 Gravers Ln
- 2002 Gravers Ln
- 2000 Floral Dr
- 2004 Gravers Ln
- 2006 Floral Dr
- 2000 Gravers Ln
- 2006 Gravers Ln
- 2009 Gravers Ln
- 2008 Floral Dr
- 2008 Gravers Ln
- 1925 Gravers Ln
- 2302 Matwood Rd
- 2001 Floral Dr
- 2003 Floral Dr
- 1924 Floral Dr
Your Personal Tour Guide
Ask me questions while you tour the home.