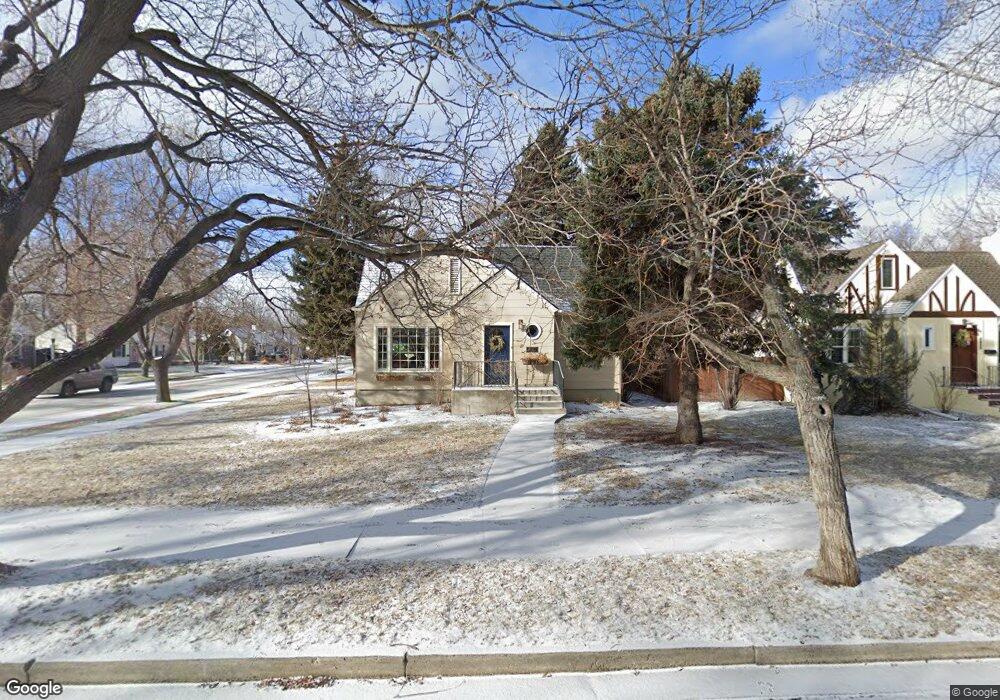
2004 Pine St Billings, MT 59101
Hilands NeighborhoodEstimated Value: $396,000 - $445,000
3
Beds
2
Baths
1,960
Sq Ft
$216/Sq Ft
Est. Value
About This Home
This home is located at 2004 Pine St, Billings, MT 59101 and is currently estimated at $423,336, approximately $215 per square foot. 2004 Pine St is a home located in Yellowstone County with nearby schools including McKinley School, Lewis & Clark Junior High School, and Billings Senior High School.
Ownership History
Date
Name
Owned For
Owner Type
Purchase Details
Closed on
Jul 10, 2023
Sold by
Court Rachel C
Bought by
Hirt Christopher and Hirt Angela
Current Estimated Value
Home Financials for this Owner
Home Financials are based on the most recent Mortgage that was taken out on this home.
Original Mortgage
$210,000
Outstanding Balance
$204,783
Interest Rate
6.79%
Mortgage Type
New Conventional
Estimated Equity
$218,553
Purchase Details
Closed on
Feb 13, 2008
Sold by
Utterback Cory L and Gray Dorinda S
Bought by
Court Rachel C
Home Financials for this Owner
Home Financials are based on the most recent Mortgage that was taken out on this home.
Original Mortgage
$164,000
Interest Rate
6.04%
Mortgage Type
Purchase Money Mortgage
Create a Home Valuation Report for This Property
The Home Valuation Report is an in-depth analysis detailing your home's value as well as a comparison with similar homes in the area
Home Values in the Area
Average Home Value in this Area
Purchase History
| Date | Buyer | Sale Price | Title Company |
|---|---|---|---|
| Hirt Christopher | -- | Chicago Title | |
| Court Rachel C | -- | None Available |
Source: Public Records
Mortgage History
| Date | Status | Borrower | Loan Amount |
|---|---|---|---|
| Open | Hirt Christopher | $210,000 | |
| Previous Owner | Court Rachel C | $164,000 | |
| Previous Owner | Court Rachel C | $30,750 |
Source: Public Records
Tax History
| Year | Tax Paid | Tax Assessment Tax Assessment Total Assessment is a certain percentage of the fair market value that is determined by local assessors to be the total taxable value of land and additions on the property. | Land | Improvement |
|---|---|---|---|---|
| 2025 | $3,303 | $403,100 | $60,613 | $342,487 |
| 2024 | $3,303 | $342,800 | $54,505 | $288,295 |
| 2023 | $3,117 | $323,700 | $54,505 | $269,195 |
| 2022 | $2,700 | $244,700 | $0 | $0 |
| 2021 | $2,571 | $244,700 | $0 | $0 |
| 2020 | $2,718 | $249,000 | $0 | $0 |
| 2019 | $2,588 | $249,000 | $0 | $0 |
| 2018 | $2,178 | $203,000 | $0 | $0 |
| 2017 | $2,114 | $203,000 | $0 | $0 |
| 2016 | $2,112 | $205,300 | $0 | $0 |
| 2015 | $2,060 | $205,300 | $0 | $0 |
| 2014 | $2,016 | $107,007 | $0 | $0 |
Source: Public Records
Map
Nearby Homes
- 2223 Elm St
- 240 Beverly Hill Blvd
- 545 Beverly Hill Blvd
- 509 Avenue E
- 607 Avenue F Unit 4
- 202 Avenue E
- 609 Avenue D
- 229 Avenue B
- 122 Avenue D
- 641 Avenue C
- 803 Parkhill Dr
- 1907 St Peter Ln
- 1933 St Peter Ln
- 1919 St Peter Ln
- 1929 St Peter Ln
- 1925 St Peter Ln
- 1913 St Peter Ln
- 1617 8th St W Unit C
- 135 Grand Ave
- 2620 Highwood Dr
- 2008 Pine St
- 2003 Spruce St
- 2007 Spruce St
- 408 Beverly Hill Blvd
- 2003 Pine St
- 402 Beverly Hill Blvd
- 420 Beverly Hill Blvd
- 2007 Pine St
- 2202 Pine St
- 400 Beverly Hill Blvd
- 422 Beverly Hill Blvd
- 2203 Spruce St
- 346 Beverly Hill Blvd
- 426 Beverly Hill Blvd
- 2208 Pine St
- 2203 Pine St
- 433 Beverly Hill Blvd
- 2207 Spruce St
- 2004 Elm St
- 2008 Spruce St
Your Personal Tour Guide
Ask me questions while you tour the home.