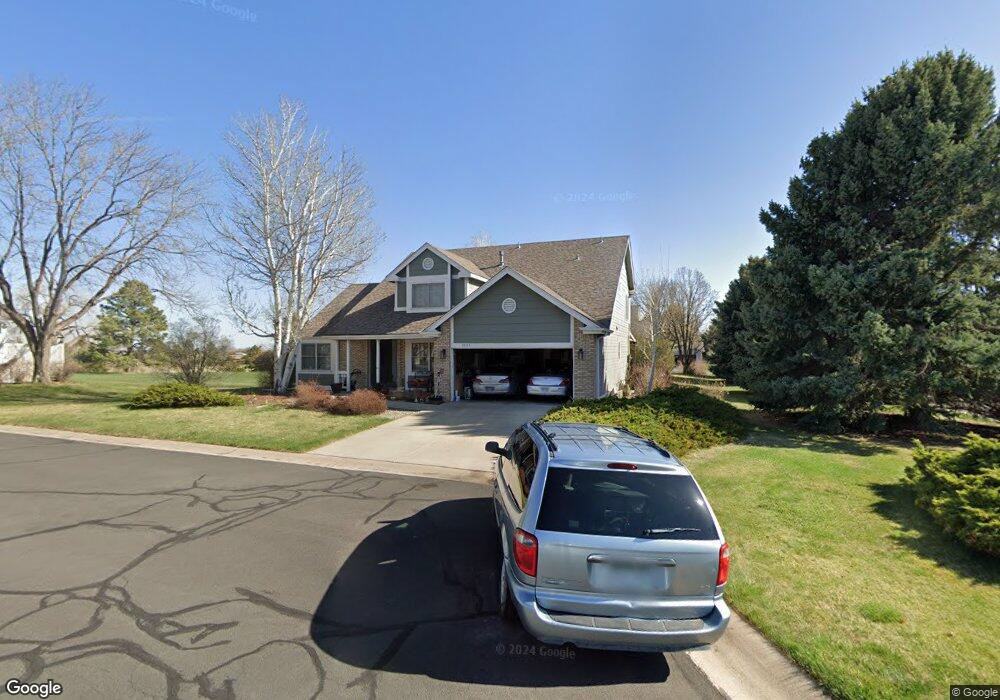
2005 Simsbury Ct Fort Collins, CO 80524
Estimated Value: $592,000 - $650,000
3
Beds
4
Baths
2,015
Sq Ft
$306/Sq Ft
Est. Value
About This Home
This home is located at 2005 Simsbury Ct, Fort Collins, CO 80524 and is currently estimated at $616,037, approximately $305 per square foot. 2005 Simsbury Ct is a home located in Larimer County with nearby schools including Tavelli Elementary School, Lincoln Middle School, and Poudre High School.
Ownership History
Date
Name
Owned For
Owner Type
Purchase Details
Closed on
Oct 4, 2021
Sold by
Fredlake David J and Fredlake Margo D
Bought by
Fredlake Living Trust
Current Estimated Value
Purchase Details
Closed on
Dec 15, 2000
Sold by
Chesapeake Homeowners Assn Inc
Bought by
Fredlake David J and Fredlake Margo D
Purchase Details
Closed on
Mar 27, 1997
Sold by
Fredlake David J
Bought by
Fredlake David J and Fredlake Margo D
Home Financials for this Owner
Home Financials are based on the most recent Mortgage that was taken out on this home.
Original Mortgage
$96,000
Interest Rate
7.63%
Purchase Details
Closed on
Jul 1, 1992
Sold by
Super Group Inc
Bought by
Gould Dick Inc
Purchase Details
Closed on
Mar 1, 1992
Sold by
Gould Dick Inc
Bought by
Fredlake Margo D
Create a Home Valuation Report for This Property
The Home Valuation Report is an in-depth analysis detailing your home's value as well as a comparison with similar homes in the area
Home Values in the Area
Average Home Value in this Area
Purchase History
| Date | Buyer | Sale Price | Title Company |
|---|---|---|---|
| Fredlake Living Trust | -- | None Available | |
| Fredlake David J | -- | -- | |
| Fredlake David J | -- | Land Title | |
| Fredlake David J | -- | Land Title | |
| Gould Dick Inc | -- | -- | |
| Fredlake Margo D | $139,000 | -- |
Source: Public Records
Mortgage History
| Date | Status | Borrower | Loan Amount |
|---|---|---|---|
| Previous Owner | Fredlake David J | $96,000 |
Source: Public Records
Tax History Compared to Growth
Tax History
| Year | Tax Paid | Tax Assessment Tax Assessment Total Assessment is a certain percentage of the fair market value that is determined by local assessors to be the total taxable value of land and additions on the property. | Land | Improvement |
|---|---|---|---|---|
| 2025 | $2,915 | $40,374 | $2,680 | $37,694 |
| 2024 | $2,775 | $40,374 | $2,680 | $37,694 |
| 2022 | $2,188 | $29,871 | $2,780 | $27,091 |
| 2021 | $2,207 | $30,731 | $2,860 | $27,871 |
| 2020 | $1,914 | $27,427 | $2,860 | $24,567 |
| 2019 | $2,601 | $27,427 | $2,860 | $24,567 |
| 2018 | $2,515 | $27,360 | $2,880 | $24,480 |
| 2017 | $2,507 | $27,360 | $2,880 | $24,480 |
| 2016 | $2,258 | $24,517 | $3,184 | $21,333 |
| 2015 | $2,242 | $25,440 | $3,180 | $22,260 |
| 2014 | $1,979 | $21,510 | $3,180 | $18,330 |
Source: Public Records
Map
Nearby Homes
- 1604 Heber Dr
- 2126 Friar Tuck Ct
- 2150 Sherwood Forest Ct
- 2221 Chesapeake Dr
- 1545 Adriel Ct Unit 1545
- 1508 Linden Lake Rd
- 1643 Adriel Dr Unit 1643
- 1311 S View Cir
- 1614 Hillside Dr
- 2327 Sunbury Ln
- 1412 Wimbledon Ct
- 2305 Turnberry Rd
- 2332 Marshfield Ln
- 1328 Hillside Dr
- 1300 Steeplechase Dr
- 2427 Maple Hill Dr
- 2513 Banbury Ln
- 1208 Miramont Dr
- 1310 Country Club Rd
- 2463 Clarion Ln
- 2008 Shelburne Ct
- 2016 Simsbury Ct
- 2012 Simsbury Ct
- 2012 Shelburne Ct
- 1923 Simsbury Ct
- 2004 Simsbury Ct
- 1924 Shelburne Ct
- 1919 Simsbury Ct
- 2013 Shelburne Ct
- 1709 Barrington Ct
- 2009 Shelburne Ct
- 2005 Shelburne Ct
- 1920 Simsbury Ct
- 1717 Barrington Ct
- 1915 Simsbury Ct
- 1912 Simsbury Ct
- 1916 Shelburne Ct
- 1916 Simsbury Ct
- 1919 Shelburne Ct
- 1712 Barrington Ct