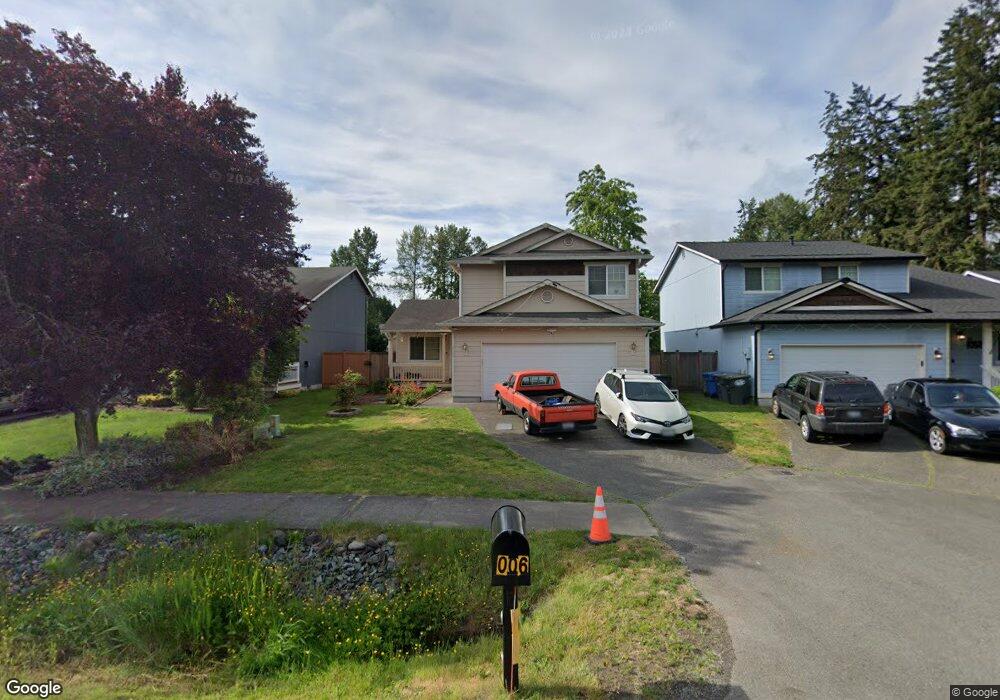
2006 86th St E Tacoma, WA 98445
Midland NeighborhoodEstimated Value: $487,572 - $545,000
3
Beds
3
Baths
1,576
Sq Ft
$332/Sq Ft
Est. Value
About This Home
This home is located at 2006 86th St E, Tacoma, WA 98445 and is currently estimated at $523,143, approximately $331 per square foot. 2006 86th St E is a home located in Pierce County with nearby schools including Harvard Elementary School, Morris Ford Middle School, and Franklin Pierce High School.
Ownership History
Date
Name
Owned For
Owner Type
Purchase Details
Closed on
Dec 15, 2005
Sold by
Chum Ban and Kong Punlok
Bought by
Leng Savy
Current Estimated Value
Home Financials for this Owner
Home Financials are based on the most recent Mortgage that was taken out on this home.
Original Mortgage
$184,000
Outstanding Balance
$101,907
Interest Rate
6.12%
Mortgage Type
Fannie Mae Freddie Mac
Estimated Equity
$421,236
Purchase Details
Closed on
Jun 25, 2003
Sold by
Sager Construction Inc
Bought by
Chum Ban and Kong Punlok
Home Financials for this Owner
Home Financials are based on the most recent Mortgage that was taken out on this home.
Original Mortgage
$133,560
Interest Rate
5.37%
Mortgage Type
Purchase Money Mortgage
Purchase Details
Closed on
Dec 10, 2002
Sold by
Harr Family Homes Inc
Bought by
Sager Construction Inc
Create a Home Valuation Report for This Property
The Home Valuation Report is an in-depth analysis detailing your home's value as well as a comparison with similar homes in the area
Home Values in the Area
Average Home Value in this Area
Purchase History
| Date | Buyer | Sale Price | Title Company |
|---|---|---|---|
| Leng Savy | $230,000 | First American Title Ins Co | |
| Chum Ban | $166,950 | Rtc | |
| Sager Construction Inc | $230,000 | Fat |
Source: Public Records
Mortgage History
| Date | Status | Borrower | Loan Amount |
|---|---|---|---|
| Open | Leng Savy | $184,000 | |
| Previous Owner | Chum Ban | $133,560 | |
| Closed | Chum Ban | $33,390 |
Source: Public Records
Tax History Compared to Growth
Tax History
| Year | Tax Paid | Tax Assessment Tax Assessment Total Assessment is a certain percentage of the fair market value that is determined by local assessors to be the total taxable value of land and additions on the property. | Land | Improvement |
|---|---|---|---|---|
| 2025 | $4,644 | $439,500 | $156,500 | $283,000 |
| 2024 | $4,644 | $414,600 | $156,500 | $258,100 |
| 2023 | $4,644 | $398,200 | $156,500 | $241,700 |
| 2022 | $4,308 | $415,700 | $150,700 | $265,000 |
| 2021 | $3,859 | $288,400 | $89,200 | $199,200 |
| 2019 | $3,192 | $267,400 | $79,600 | $187,800 |
| 2018 | $3,764 | $247,800 | $71,700 | $176,100 |
| 2017 | $3,582 | $223,300 | $56,900 | $166,400 |
| 2016 | $3,191 | $191,100 | $46,100 | $145,000 |
| 2014 | $2,787 | $170,300 | $39,800 | $130,500 |
| 2013 | $2,787 | $155,000 | $37,600 | $117,400 |
Source: Public Records
Map
Nearby Homes
- 2011 85th Street Ct E
- 2014 88th St E
- 8322 19th Avenue Ct E Unit 11
- 8311 19th Avenue Ct E Unit 27
- 1720 80th St E
- 8507 13th Ave E
- 8508 13th Ave E
- 13923 17th St E Unit 51
- Hawthorn Plan at Eagle Landing
- Mercer Plan at Eagle Landing
- 2420 92nd St E
- 7810 25th Ave E
- 2005 77th Street Ct E
- 8519 Golden Given Rd E
- 8515 Golden Given Rd E
- 8518 Golden Given Rd E
- 1821 75th St E Unit 5
- 9607 24th Ave E
- 7410 25th Ave E
- 908 85th St E
- 2012 86th St E
- 1926 86th St E
- 2018 86th St E
- 1918 86th St E
- 2022 86th St E
- 1914 86th St E
- 2009 88th St E
- 2026 86th St E
- 1910 86th St E
- 2010 85th Street Ct E
- 2002 85th Street Ct E
- 8526 21st Ave E
- 2028 86th St E
- 1906 86th St E
- 2006 85th Street Ct E
- 8522 21st Ave E
- 2106 86th St E
- 1902 86th St E
- 8527 21st Ave E
- 2110 86th St E