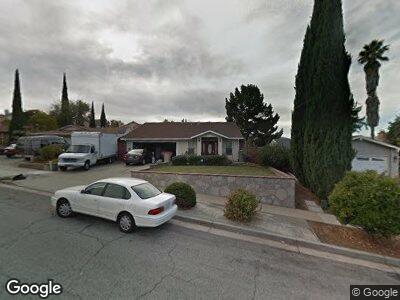
2006 Cranworth Cir San Jose, CA 95121
Brigadoon NeighborhoodEstimated Value: $1,346,000 - $1,630,000
3
Beds
3
Baths
1,000
Sq Ft
$1,472/Sq Ft
Est. Value
About This Home
This home is located at 2006 Cranworth Cir, San Jose, CA 95121 and is currently estimated at $1,472,143, approximately $1,472 per square foot. 2006 Cranworth Cir is a home located in Santa Clara County with nearby schools including John J. Montgomery Elementary School, Chaboya Middle School, and Silver Creek High School.
Ownership History
Date
Name
Owned For
Owner Type
Purchase Details
Closed on
Sep 21, 2020
Sold by
Ocmeja Jocelyn Y
Bought by
Ocmeja Jocelyn Y and 2018 Jocelyn Y
Current Estimated Value
Home Financials for this Owner
Home Financials are based on the most recent Mortgage that was taken out on this home.
Original Mortgage
$246,000
Outstanding Balance
$181,452
Interest Rate
2.8%
Mortgage Type
New Conventional
Estimated Equity
$1,290,691
Purchase Details
Closed on
Nov 29, 2018
Sold by
Ocmeja Jocelyn
Bought by
Ocmeja Jocelyn N and The 2018 Jocelyn Y Ocmeja Revo
Purchase Details
Closed on
Sep 11, 1995
Sold by
Turnoy Sharon E
Bought by
Ocmeja Bibiano and Ocmeja Jocelyn
Home Financials for this Owner
Home Financials are based on the most recent Mortgage that was taken out on this home.
Original Mortgage
$119,500
Interest Rate
7.88%
Create a Home Valuation Report for This Property
The Home Valuation Report is an in-depth analysis detailing your home's value as well as a comparison with similar homes in the area
Home Values in the Area
Average Home Value in this Area
Purchase History
| Date | Buyer | Sale Price | Title Company |
|---|---|---|---|
| Ocmeja Jocelyn Y | -- | Amrock | |
| Ocmeja Jocelyn Y | -- | Amrock | |
| Ocmeja Jocelyn N | -- | None Available | |
| Ocmeja Bibiano | $169,500 | Stewart Title |
Source: Public Records
Mortgage History
| Date | Status | Borrower | Loan Amount |
|---|---|---|---|
| Open | Ocmeja Jocelyn Y | $246,000 | |
| Closed | Ocmeja Bibiano | $266,000 | |
| Closed | Ocmeja Bibiano | $150,100 | |
| Closed | Ocmeja Bibiano | $143,000 | |
| Closed | Ocmeja Bibiano | $100,000 | |
| Closed | Ocmeja Bibiano | $50,000 | |
| Closed | Ocmeja Bibiano | $200,000 | |
| Closed | Ocmeja Bibiano | $100,000 | |
| Closed | Ocmeja Bibiano | $119,500 |
Source: Public Records
Tax History Compared to Growth
Tax History
| Year | Tax Paid | Tax Assessment Tax Assessment Total Assessment is a certain percentage of the fair market value that is determined by local assessors to be the total taxable value of land and additions on the property. | Land | Improvement |
|---|---|---|---|---|
| 2024 | $6,728 | $399,511 | $110,410 | $289,101 |
| 2023 | $6,577 | $391,679 | $108,246 | $283,433 |
| 2022 | $6,541 | $384,000 | $106,124 | $277,876 |
| 2021 | $6,394 | $376,472 | $104,044 | $272,428 |
| 2020 | $6,020 | $372,613 | $102,978 | $269,635 |
| 2019 | $5,856 | $365,308 | $100,959 | $264,349 |
| 2018 | $5,774 | $358,146 | $98,980 | $259,166 |
| 2017 | $5,677 | $351,125 | $97,040 | $254,085 |
| 2016 | $5,412 | $344,241 | $95,138 | $249,103 |
| 2015 | $5,335 | $339,071 | $93,709 | $245,362 |
| 2014 | $4,775 | $332,430 | $91,874 | $240,556 |
Source: Public Records
Map
Nearby Homes
- 2110 Toryglen Way
- 2116 Provanmill Way
- 2178 Toryglen Way
- 3351 Methilhaven Ct
- 3517 Dahill Ct
- 3367 Brigadoon Way
- 1711 Silver Meadow Ct
- 1832 Loch Ness Way
- 1781 Indigo Oak Ln
- 3495 Sugarcreek Dr
- 1734 Bagpipe Way
- 1640 Seacreek Way
- 1520 E Capitol Expy Unit 133
- 4115 Loganberry Dr
- 1288 Isengard Ct
- 3310 Shadow Park Place
- 2168 Pettigrew Dr
- 2885 Moss Hollow Dr Unit 2885
- 3226 Shadow Springs Place Unit 446
- 1822 Tustin Dr
- 2006 Cranworth Cir
- 2002 Cranworth Cir
- 2010 Cranworth Cir
- 3845 Brigadoon Way
- 2014 Cranworth Cir
- 3841 Brigadoon Way
- 2007 Cranworth Cir
- 2011 Cranworth Cir
- 3793 Ashridge Ln
- 2018 Cranworth Cir
- 3789 Ashridge Ln
- 2003 Cranworth Cir
- 3838 Brigadoon Way
- 2015 Cranworth Cir
- 3783 Ashridge Ln
- 3837 Brigadoon Way
- 2022 Cranworth Cir
- 3819 Corkerhill Way
- 3779 Ashridge Ln
- 2021 Cranworth Cir