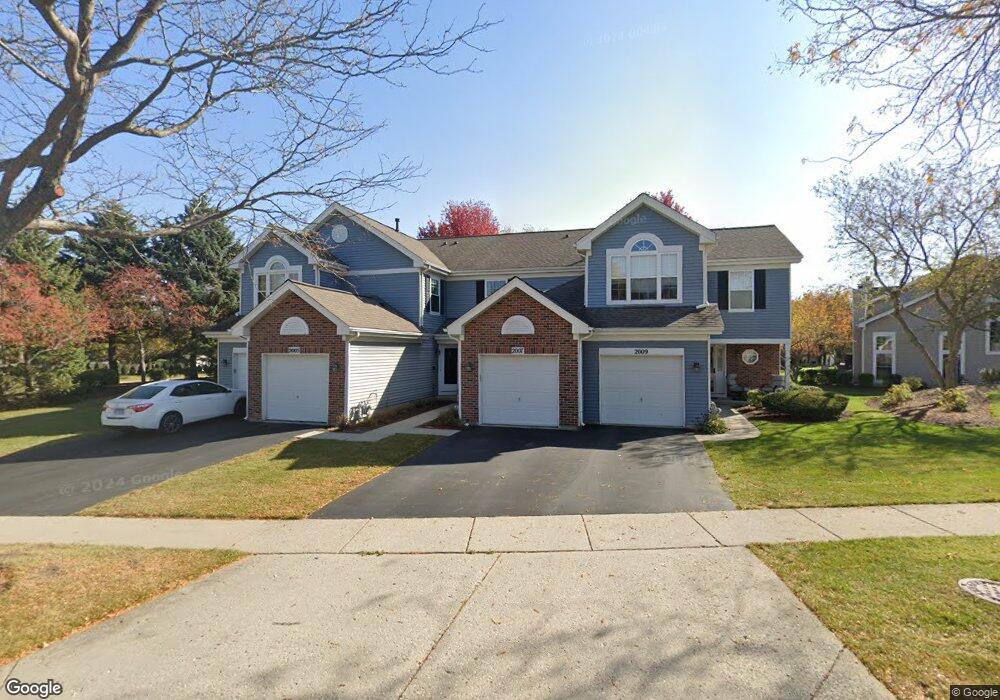
2007 Waverly Ln Unit 4423 Algonquin, IL 60102
Estimated Value: $230,000 - $253,000
2
Beds
--
Bath
1,186
Sq Ft
$202/Sq Ft
Est. Value
About This Home
This home is located at 2007 Waverly Ln Unit 4423, Algonquin, IL 60102 and is currently estimated at $239,967, approximately $202 per square foot. 2007 Waverly Ln Unit 4423 is a home located in Kane County with nearby schools including Westfield Community School and Harry D Jacobs High School.
Ownership History
Date
Name
Owned For
Owner Type
Purchase Details
Closed on
Jun 18, 2003
Sold by
Kramer Robert W
Bought by
Krug Joanne M
Current Estimated Value
Home Financials for this Owner
Home Financials are based on the most recent Mortgage that was taken out on this home.
Original Mortgage
$148,100
Outstanding Balance
$62,894
Interest Rate
5.36%
Mortgage Type
FHA
Estimated Equity
$177,073
Purchase Details
Closed on
Oct 31, 1997
Sold by
Kelly J Mark and Kelly Joy L
Bought by
Kramer Robert W
Home Financials for this Owner
Home Financials are based on the most recent Mortgage that was taken out on this home.
Original Mortgage
$94,300
Interest Rate
7.42%
Purchase Details
Closed on
Dec 20, 1994
Sold by
Willoughby Farms Townhomes Ltd Prtnrshp
Bought by
Kelly J Mark and Kelly Joy L
Home Financials for this Owner
Home Financials are based on the most recent Mortgage that was taken out on this home.
Original Mortgage
$92,700
Interest Rate
9.24%
Mortgage Type
FHA
Create a Home Valuation Report for This Property
The Home Valuation Report is an in-depth analysis detailing your home's value as well as a comparison with similar homes in the area
Home Values in the Area
Average Home Value in this Area
Purchase History
| Date | Buyer | Sale Price | Title Company |
|---|---|---|---|
| Krug Joanne M | $153,000 | Multiple | |
| Kramer Robert W | $67,666 | Burnet Title Llc | |
| Kelly J Mark | $96,500 | Chicago Title Insurance Co |
Source: Public Records
Mortgage History
| Date | Status | Borrower | Loan Amount |
|---|---|---|---|
| Open | Krug Joanne M | $148,100 | |
| Previous Owner | Kramer Robert W | $94,300 | |
| Previous Owner | Kelly J Mark | $92,700 |
Source: Public Records
Tax History Compared to Growth
Tax History
| Year | Tax Paid | Tax Assessment Tax Assessment Total Assessment is a certain percentage of the fair market value that is determined by local assessors to be the total taxable value of land and additions on the property. | Land | Improvement |
|---|---|---|---|---|
| 2024 | $4,249 | $63,882 | $8,371 | $55,511 |
| 2023 | $4,027 | $57,479 | $7,532 | $49,947 |
| 2022 | $3,444 | $47,209 | $7,532 | $39,677 |
| 2021 | $3,326 | $44,575 | $7,112 | $37,463 |
| 2020 | $3,255 | $43,573 | $6,952 | $36,621 |
| 2019 | $3,140 | $41,365 | $6,600 | $34,765 |
| 2018 | $2,947 | $37,964 | $6,469 | $31,495 |
| 2017 | $2,806 | $35,513 | $6,051 | $29,462 |
| 2016 | $2,866 | $34,385 | $5,859 | $28,526 |
| 2015 | -- | $27,462 | $5,490 | $21,972 |
| 2014 | -- | $26,703 | $5,338 | $21,365 |
| 2013 | -- | $31,990 | $5,501 | $26,489 |
Source: Public Records
Map
Nearby Homes
- 30 Arbordale Ct Unit 4284
- 1900 Waverly Ln
- 1860 Haverford Dr
- 2101 Peach Tree Ln Unit 4094
- 1971 Peach Tree Ln
- Marianne Plan at Algonquin Meadows - Traditional Townhomes
- Darcy Plan at Algonquin Meadows - Traditional Townhomes
- Charlotte Plan at Algonquin Meadows - Traditional Townhomes
- 2043 Peach Tree Ln Unit 4122
- Adams Plan at Algonquin Meadows - Single Family
- Sequoia Plan at Algonquin Meadows - Single Family
- Bryce Plan at Algonquin Meadows - Single Family
- Rainier Plan at Algonquin Meadows - Single Family
- Santa Rosa Plan at Algonquin Meadows - Single Family
- Biscayne Plan at Algonquin Meadows - Single Family
- Amherst Plan at Algonquin Meadows - Urban Townhomes
- Chatham Plan at Algonquin Meadows - Urban Townhomes
- Chelsea Plan at Algonquin Meadows - Urban Townhomes
- 000 County Line Rd
- 2060 Dorchester Ave
- 2003 Waverly Ln Unit 4414
- 2005 Waverly Ln
- 2009 Waverly Ln Unit 4424
- 2027 Waverly Ln Unit 441
- 2029 Waverly Ln Unit 4412
- 8 Stonegate Ct Unit 4433
- 2 Stonegate Ct Unit 4436
- 2033 Waverly Ln Unit 4414
- 2006 Waverly Ln Unit 4291
- 10 Stonegate Ct Unit 4432
- 2035 Waverly Ln Unit 4415
- 2035 Waverly Ln Unit 2035
- 6 Stonegate Ct Unit 4434
- 2000 Waverly Ln Unit 4294
- 2000 Waverly Ln Unit 2036
- 2037 Waverly Ln Unit 4416
- 2004 Waverly Ln Unit 4292
- 2002 Waverly Ln Unit 4293
- 2004 Waverly Ln Unit 2004
- 2002 Waverly Ln Unit A