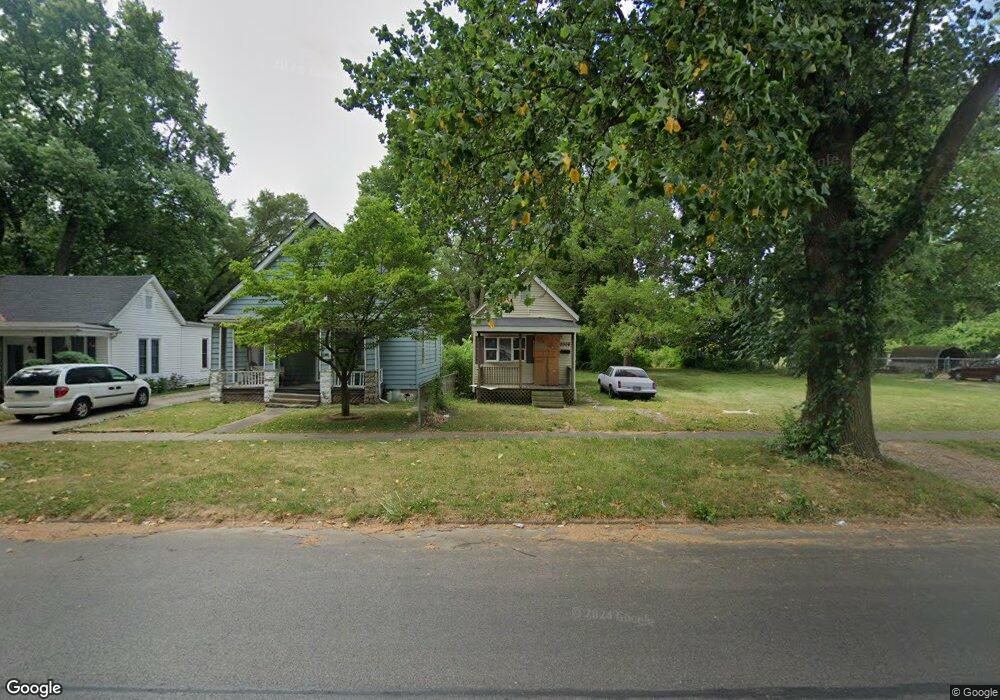
2008 E Capitol Ave Springfield, IL 62703
Estimated Value: $48,559 - $59,000
Studio
--
Bath
--
Sq Ft
2,962
Sq Ft Lot
About This Home
This home is located at 2008 E Capitol Ave, Springfield, IL 62703 and is currently estimated at $53,890. 2008 E Capitol Ave is a home located in Sangamon County with nearby schools including Fairview Elementary School, Washington Middle School, and Lanphier High School.
Ownership History
Date
Name
Owned For
Owner Type
Purchase Details
Closed on
Aug 25, 2022
Sold by
Foe Rental & Removel
Bought by
Young Lloyd C
Current Estimated Value
Purchase Details
Closed on
Oct 6, 2020
Sold by
Persley Yvonne
Bought by
Foe Rental & Renovel
Purchase Details
Closed on
Feb 16, 2018
Sold by
Lawson Properties Enterprises
Bought by
Persley Yvonne
Purchase Details
Closed on
Dec 6, 2017
Sold by
R & M Properties
Bought by
Lawson Properties Enterprises
Purchase Details
Closed on
Oct 31, 2017
Sold by
Power House Properties Trust
Bought by
R & M Properties
Purchase Details
Closed on
Oct 23, 2017
Sold by
Bluestem Properties Llc
Bought by
Power House Properties
Purchase Details
Closed on
Jul 23, 2015
Purchase Details
Closed on
Mar 1, 2011
Purchase Details
Closed on
May 16, 2008
Purchase Details
Closed on
Oct 16, 2007
Purchase Details
Closed on
Dec 4, 2006
Purchase Details
Closed on
Jan 29, 1996
Create a Home Valuation Report for This Property
The Home Valuation Report is an in-depth analysis detailing your home's value as well as a comparison with similar homes in the area
Purchase History
| Date | Buyer | Sale Price | Title Company |
|---|---|---|---|
| Young Lloyd C | -- | None Listed On Document | |
| Foe Rental & Renovel | -- | Lawson T | |
| Persley Yvonne | -- | -- | |
| Lawson Properties Enterprises | -- | -- | |
| R & M Properties | -- | -- | |
| Power House Properties | $4,000 | -- | |
| Bluestem Properties Llc | -- | -- | |
| -- | -- | -- | |
| -- | -- | -- | |
| -- | -- | -- | |
| -- | -- | -- | |
| -- | -- | -- | |
| -- | $6,200 | -- |
Source: Public Records
Tax History
| Year | Tax Paid | Tax Assessment Tax Assessment Total Assessment is a certain percentage of the fair market value that is determined by local assessors to be the total taxable value of land and additions on the property. | Land | Improvement |
|---|---|---|---|---|
| 2024 | $599 | $7,132 | $789 | $6,343 |
| 2023 | $576 | $6,515 | $721 | $5,794 |
| 2022 | $554 | $6,180 | $684 | $5,496 |
| 2021 | $535 | $5,948 | $658 | $5,290 |
| 2020 | $525 | $5,957 | $659 | $5,298 |
| 2019 | $515 | $5,937 | $657 | $5,280 |
| 2018 | $500 | $5,916 | $654 | $5,262 |
| 2017 | $490 | $5,840 | $646 | $5,194 |
| 2016 | $480 | $5,755 | $637 | $5,118 |
| 2015 | $475 | $5,686 | $629 | $5,057 |
| 2014 | $505 | $5,649 | $625 | $5,024 |
| 2013 | $494 | $6,097 | $625 | $5,472 |
Source: Public Records
Map
Nearby Homes
- 2128 E Capitol Ave
- 2236 E Adams St
- 222 S David St
- 1529 E Edwards St
- 1405 E Edwards St
- 1415 E Jefferson St
- 2238 E Stuart St
- 300 Forrest Ave Unit 107
- 1105 Knoll Pointe Place
- 1909 E Cedar St
- 1617 E Matheny Ave
- 1521 E Matheny Ave
- 2325 E Spruce St
- 1123 E Miller St
- 516 N Milton Ave Unit 1
- 718 S 7th St Unit 1003
- 718 S 7th St Unit 405
- 718 S 7th St Unit 904
- 1838 S 19th St
- 905 N Wesley St Unit 1
- 2012 E Capitol Ave
- 2014 E Capitol Ave
- 2016 E Capitol Ave
- 2000 E Capitol Ave
- 2022 E Capitol Ave
- 2013 E Capitol Ave
- 2011 E Capitol Ave
- 2017 E Capitol Ave
- 2009 E Capitol Ave
- 2007 E Capitol Ave
- 2026 E Capitol Ave
- 2019 E Capitol Ave
- 2021 E Capitol Ave
- 2028 E Capitol Ave
- 2007 E Jackson St
- 2009 E Jackson St
- 2025 E Capitol Ave
- 2011 E Jackson St
- 2027 E Capitol Ave
- 1952 E Capitol Ave
Your Personal Tour Guide
Ask me questions while you tour the home.