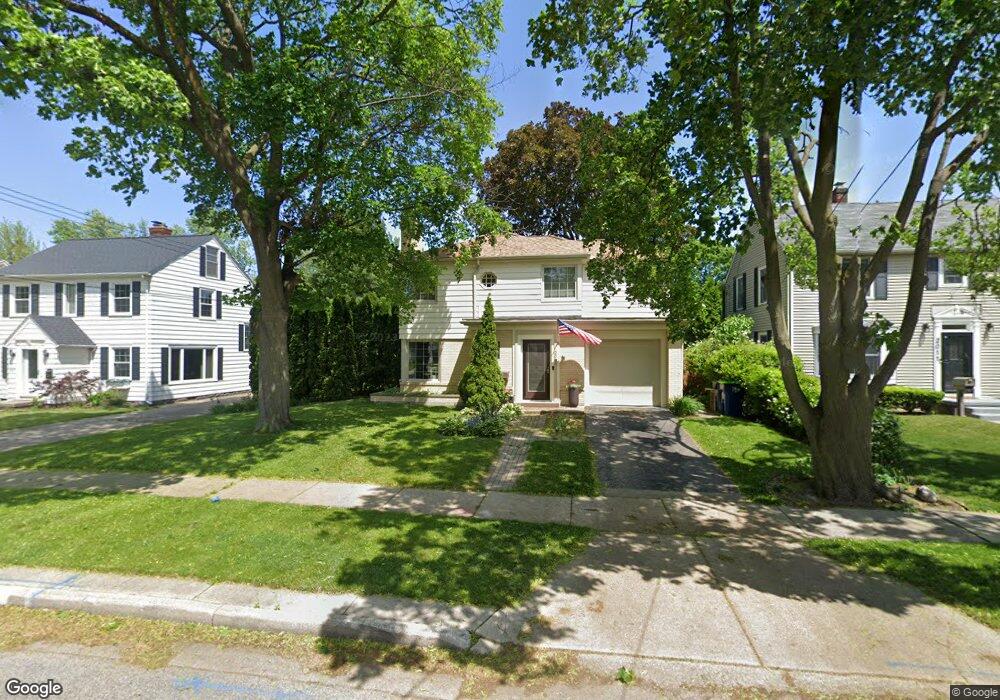
2009 11th St Bay City, MI 48708
Estimated Value: $158,000 - $184,000
4
Beds
2
Baths
1,390
Sq Ft
$125/Sq Ft
Est. Value
About This Home
This home is located at 2009 11th St, Bay City, MI 48708 and is currently estimated at $173,659, approximately $124 per square foot. 2009 11th St is a home located in Bay County with nearby schools including Washington Elementary School, Handy Middle School, and Bay City Central High School.
Ownership History
Date
Name
Owned For
Owner Type
Purchase Details
Closed on
Aug 16, 2005
Sold by
Bruzewski Molly K
Bought by
Klosowski Larry
Current Estimated Value
Home Financials for this Owner
Home Financials are based on the most recent Mortgage that was taken out on this home.
Original Mortgage
$107,900
Outstanding Balance
$56,791
Interest Rate
5.69%
Mortgage Type
Fannie Mae Freddie Mac
Estimated Equity
$116,868
Purchase Details
Closed on
Nov 19, 1999
Sold by
Terbush Brian and Terbush Shelley
Bought by
Bruzewski Molly K
Create a Home Valuation Report for This Property
The Home Valuation Report is an in-depth analysis detailing your home's value as well as a comparison with similar homes in the area
Home Values in the Area
Average Home Value in this Area
Purchase History
| Date | Buyer | Sale Price | Title Company |
|---|---|---|---|
| Klosowski Larry | $134,900 | Fatic | |
| Bruzewski Molly K | $100,000 | -- |
Source: Public Records
Mortgage History
| Date | Status | Borrower | Loan Amount |
|---|---|---|---|
| Open | Klosowski Larry | $107,900 | |
| Closed | Klosowski Larry | $4,000 |
Source: Public Records
Tax History Compared to Growth
Tax History
| Year | Tax Paid | Tax Assessment Tax Assessment Total Assessment is a certain percentage of the fair market value that is determined by local assessors to be the total taxable value of land and additions on the property. | Land | Improvement |
|---|---|---|---|---|
| 2025 | $2,444 | $86,250 | $0 | $0 |
| 2024 | $2,012 | $76,950 | $0 | $0 |
| 2023 | $1,915 | $67,350 | $0 | $0 |
| 2022 | $2,200 | $60,850 | $0 | $0 |
| 2021 | $2,069 | $57,150 | $57,150 | $0 |
| 2020 | $2,200 | $53,950 | $53,950 | $0 |
| 2019 | $2,152 | $51,000 | $0 | $0 |
| 2018 | $2,130 | $49,650 | $0 | $0 |
| 2017 | $2,084 | $48,850 | $0 | $0 |
| 2016 | $2,073 | $42,100 | $0 | $42,100 |
| 2015 | $2,723 | $43,150 | $0 | $43,150 |
| 2014 | $2,723 | $55,850 | $0 | $55,850 |
Source: Public Records
Map
Nearby Homes