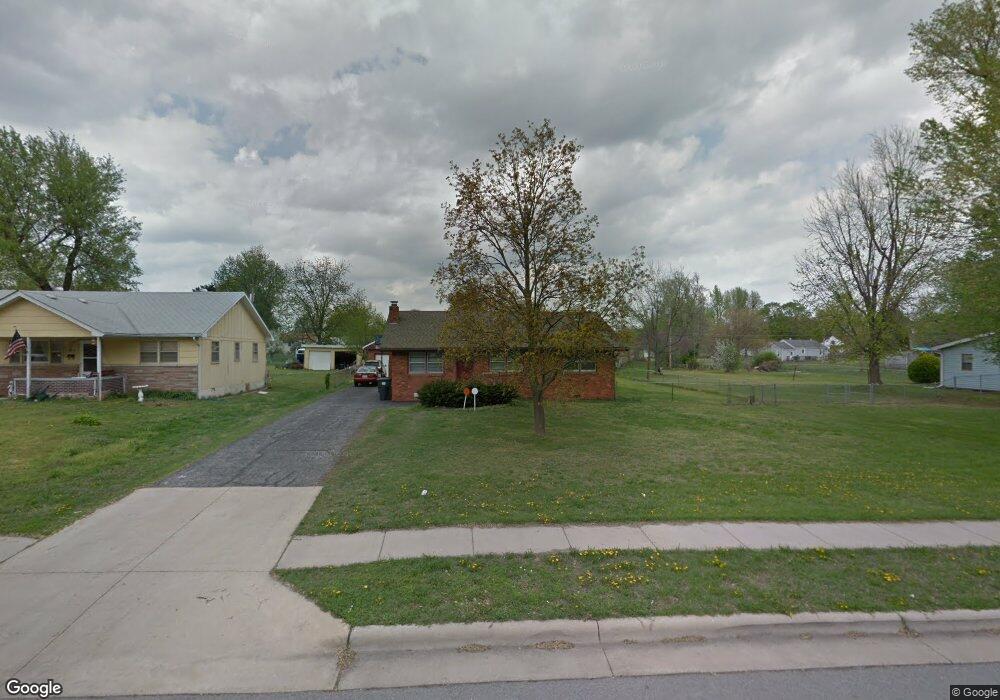
2009 E Elm St Springfield, MO 65802
Bingham NeighborhoodEstimated Value: $209,000 - $266,000
4
Beds
2
Baths
1,929
Sq Ft
$121/Sq Ft
Est. Value
About This Home
This home is located at 2009 E Elm St, Springfield, MO 65802 and is currently estimated at $233,817, approximately $121 per square foot. 2009 E Elm St is a home located in Greene County with nearby schools including Bingham Elementary School, Hickory Hills K-8 School, and Central High School.
Ownership History
Date
Name
Owned For
Owner Type
Purchase Details
Closed on
Sep 30, 2020
Sold by
Mullen Scott E and Mullen Marlene
Bought by
Mullen Scott E and Mullen Marlene A
Current Estimated Value
Purchase Details
Closed on
Jun 6, 2008
Sold by
Morris Ralph Thomas and Masterson Theresa M
Bought by
Mullen Scott E and Mullen Edward K
Home Financials for this Owner
Home Financials are based on the most recent Mortgage that was taken out on this home.
Original Mortgage
$123,920
Outstanding Balance
$79,600
Interest Rate
6.07%
Mortgage Type
FHA
Estimated Equity
$154,217
Purchase Details
Closed on
May 13, 2005
Sold by
Smittle Chester L
Bought by
Moris Ralph Thomas
Create a Home Valuation Report for This Property
The Home Valuation Report is an in-depth analysis detailing your home's value as well as a comparison with similar homes in the area
Home Values in the Area
Average Home Value in this Area
Purchase History
| Date | Buyer | Sale Price | Title Company |
|---|---|---|---|
| Mullen Scott E | -- | Waco Title Co Springfield | |
| Mullen Scott E | -- | None Available | |
| Moris Ralph Thomas | -- | None Available |
Source: Public Records
Mortgage History
| Date | Status | Borrower | Loan Amount |
|---|---|---|---|
| Open | Mullen Scott E | $123,920 |
Source: Public Records
Tax History
| Year | Tax Paid | Tax Assessment Tax Assessment Total Assessment is a certain percentage of the fair market value that is determined by local assessors to be the total taxable value of land and additions on the property. | Land | Improvement |
|---|---|---|---|---|
| 2025 | $1,598 | $32,080 | $5,000 | $27,080 |
| 2024 | $1,067 | $19,890 | $4,750 | $15,140 |
| 2023 | $1,061 | $19,890 | $4,750 | $15,140 |
| 2022 | $1,018 | $18,640 | $4,750 | $13,890 |
| 2021 | $1,018 | $18,640 | $4,750 | $13,890 |
| 2020 | $999 | $17,500 | $4,750 | $12,750 |
| 2019 | $971 | $17,500 | $4,750 | $12,750 |
| 2018 | $953 | $17,180 | $3,800 | $13,380 |
| 2017 | $943 | $16,640 | $3,800 | $12,840 |
| 2016 | $912 | $16,640 | $3,800 | $12,840 |
| 2015 | $904 | $16,640 | $3,800 | $12,840 |
| 2014 | $880 | $16,090 | $3,800 | $12,290 |
Source: Public Records
Map
Nearby Homes
- 1936 E Cairo St
- 607 S Grandview Ave
- 613 S Wildan Ave
- 1909 E Cherry Street Ct
- 2114 E Cairo St
- 1737 E Walnut St
- 1700 E Cairo St
- 1838 E Monroe Terrace
- 2143 E Madison St
- 1725 E Lombard St
- 1525 E Cairo St
- 846 S Barnes Ave
- 516 S Weller Ave
- 338 S Weller Ave
- 1462 E Mcdaniel St
- 756 S Weller Ave
- 1435 E Walnut St
- 217 S Pickwick Ave
- 1638 E Belmont St
- 2545 E Cherry St
- 2003 E Elm St
- 1951 E Elm St
- 2023 E Elm St
- 1947 E Elm St
- 2010 E Walnut St
- 2006 E Walnut St
- 2016 E Walnut St
- 2000 E Walnut St
- 1941 E Elm St
- 2020 E Walnut St
- 2033 E Elm St
- 1952 E Walnut St
- 2010 E Elm St
- 2000 E Elm St
- 2024 E Elm St
- 2018 E Elm St
- 1935 E Elm St
- 1946 E Walnut St
- 1950 E Elm St
- 2039 E Elm St
Your Personal Tour Guide
Ask me questions while you tour the home.