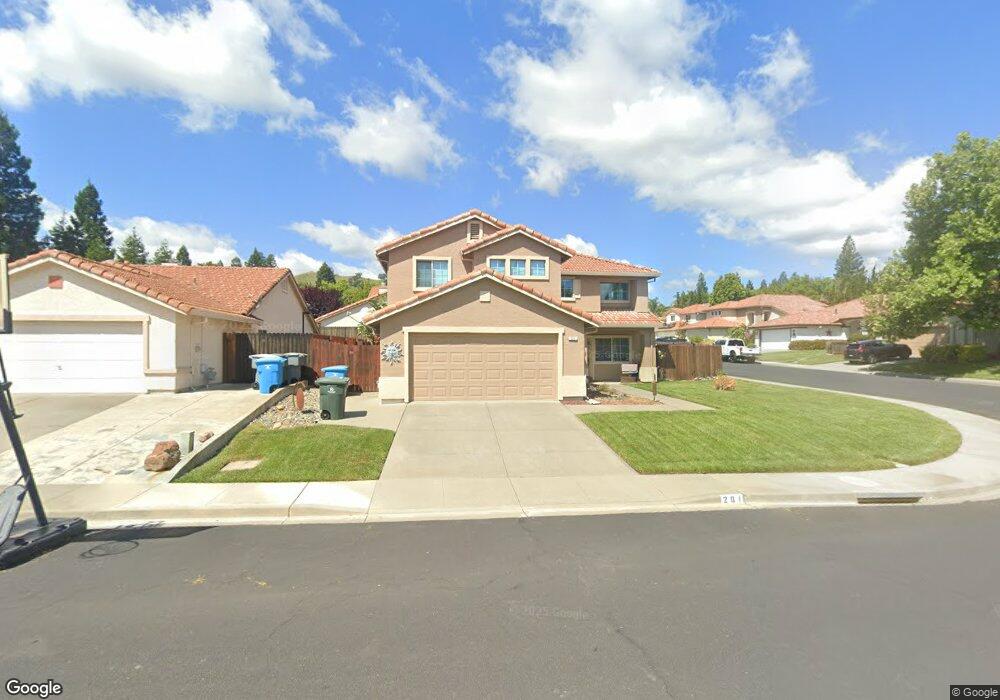
201 Boulderidge Ct Vacaville, CA 95688
Estimated Value: $718,103 - $768,000
4
Beds
3
Baths
2,415
Sq Ft
$306/Sq Ft
Est. Value
About This Home
This home is located at 201 Boulderidge Ct, Vacaville, CA 95688 and is currently estimated at $739,026, approximately $306 per square foot. 201 Boulderidge Ct is a home located in Solano County with nearby schools including Browns Valley Elementary School, Willis Jepson Middle School, and Vacaville High School.
Ownership History
Date
Name
Owned For
Owner Type
Purchase Details
Closed on
Oct 16, 2023
Sold by
Beckman Steven Richard
Bought by
Steven R Beckman Revocable Living Trust and Beckman
Current Estimated Value
Purchase Details
Closed on
Apr 13, 2011
Sold by
Beckman Cory
Bought by
Beckman Steve
Purchase Details
Closed on
Jul 16, 1998
Sold by
Traylor Steven R and Traylor Paula H
Bought by
Beckman Steve and Beckman Cory
Home Financials for this Owner
Home Financials are based on the most recent Mortgage that was taken out on this home.
Original Mortgage
$125,000
Interest Rate
6.95%
Purchase Details
Closed on
Jan 23, 1995
Sold by
61 Vacaville Associates L P
Bought by
Traylor Steven R and Traylor Paula Hamm
Home Financials for this Owner
Home Financials are based on the most recent Mortgage that was taken out on this home.
Original Mortgage
$189,050
Interest Rate
9.28%
Create a Home Valuation Report for This Property
The Home Valuation Report is an in-depth analysis detailing your home's value as well as a comparison with similar homes in the area
Purchase History
We collect this data history from publicly available records. To have your information removed, we recommend requesting removal directly through your county’s website.
| Date | Buyer | Sale Price | Title Company |
|---|---|---|---|
| Steven R Beckman Revocable Living Trust | -- | None Listed On Document | |
| Beckman Steve | -- | None Available | |
| Beckman Steve | $215,000 | -- | |
| Traylor Steven R | $199,000 | First American Title Guarant |
Source: Public Records
Mortgage History
We collect this data history from publicly available records. To have your information removed, we recommend requesting removal directly through your county’s website.
| Date | Status | Borrower | Loan Amount |
|---|---|---|---|
| Previous Owner | Beckman Steve | $125,000 | |
| Previous Owner | Traylor Steven R | $189,050 |
Source: Public Records
Tax History
| Year | Tax Paid | Tax Assessment Tax Assessment Total Assessment is a certain percentage of the fair market value that is determined by local assessors to be the total taxable value of land and additions on the property. | Land | Improvement |
|---|---|---|---|---|
| 2025 | $4,519 | $385,961 | $78,380 | $307,581 |
| 2024 | $4,519 | $378,394 | $76,844 | $301,550 |
| 2023 | $4,413 | $370,976 | $75,338 | $295,638 |
| 2022 | $4,333 | $363,703 | $73,861 | $289,842 |
| 2021 | $4,337 | $356,572 | $72,413 | $284,159 |
| 2020 | $4,276 | $352,917 | $71,671 | $281,246 |
| 2019 | $4,198 | $345,998 | $70,266 | $275,732 |
| 2018 | $4,147 | $339,215 | $68,889 | $270,326 |
| 2017 | $3,987 | $332,565 | $67,539 | $265,026 |
| 2016 | $3,956 | $326,045 | $66,215 | $259,830 |
| 2015 | $3,900 | $321,149 | $65,221 | $255,928 |
| 2014 | $3,667 | $314,859 | $63,944 | $250,915 |
Source: Public Records
Map
Nearby Homes
- 184 Bald Eagle Dr
- 149 Dewberry Dr
- 231 Montville Ct
- 501 Canyon Oak Dr
- 307 Trumbull Way
- 573 Rambleton Dr
- 699 Shannon Dr
- 143 Lighthouse Way
- 149 Lighthouse Way
- 639 Shannon Dr
- 254 Limerick Way
- 651 Shannon Ct
- 976 Cashel Cir
- 567 Shannon Dr
- 726 Elderberry Loop
- 736 Dellwood Ct
- 267 Sunridge Way
- 306 Shining Horse Way
- 291 Woodcrest Dr
- 612 Pacific Grove Ct
- 207 Boulderidge Ct
- 239 Bald Eagle Dr
- 213 Boulderidge Ct
- 244 Bald Eagle Dr
- 250 Bald Eagle Dr
- 233 Bald Eagle Dr
- 273 Boulderidge Ct
- 238 Bald Eagle Dr
- 267 Boulderidge Ct
- 256 Bald Eagle Dr
- 219 Boulderidge Ct
- 197 Bald Eagle Dr
- 261 Boulderidge Ct
- 232 Bald Eagle Dr
- 262 Bald Eagle Dr
- 430 Ashwood Ct
- 191 Bald Eagle Dr
- 269 Bald Eagle Dr
- 225 Boulderidge Ct
- 226 Bald Eagle Dr
Your Personal Tour Guide
Ask me questions while you tour the home.