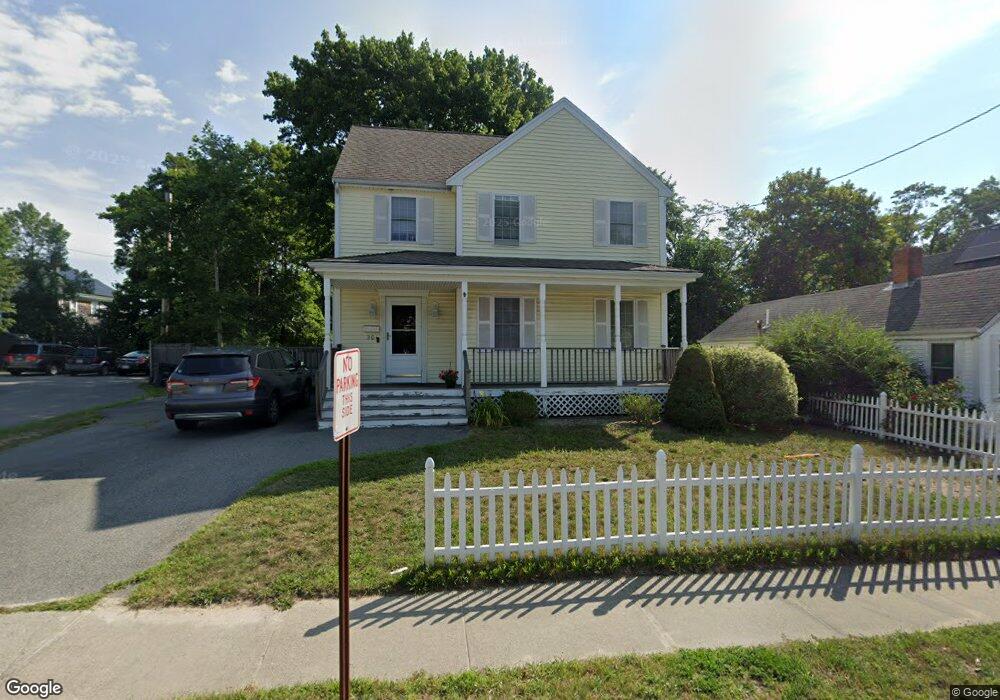
201 High St Wareham, MA 02571
Wareham Center NeighborhoodEstimated Value: $510,982 - $634,000
3
Beds
2
Baths
1,528
Sq Ft
$363/Sq Ft
Est. Value
About This Home
This home is located at 201 High St, Wareham, MA 02571 and is currently estimated at $553,996, approximately $362 per square foot. 201 High St is a home located in Plymouth County with nearby schools including Tabor Academy.
Ownership History
Date
Name
Owned For
Owner Type
Purchase Details
Closed on
Apr 4, 2008
Sold by
Pogatch Karen L
Bought by
Pesta Erik C and Pesta Erica D
Current Estimated Value
Purchase Details
Closed on
Jun 27, 2003
Sold by
Cornerstone Prop & Dev I
Bought by
Pogatch Karen L
Home Financials for this Owner
Home Financials are based on the most recent Mortgage that was taken out on this home.
Original Mortgage
$215,900
Interest Rate
5.53%
Mortgage Type
Purchase Money Mortgage
Create a Home Valuation Report for This Property
The Home Valuation Report is an in-depth analysis detailing your home's value as well as a comparison with similar homes in the area
Home Values in the Area
Average Home Value in this Area
Purchase History
| Date | Buyer | Sale Price | Title Company |
|---|---|---|---|
| Pesta Erik C | $299,000 | -- | |
| Pesta Erik C | $299,000 | -- | |
| Pogatch Karen L | $269,900 | -- | |
| Pogatch Karen L | $269,900 | -- |
Source: Public Records
Mortgage History
| Date | Status | Borrower | Loan Amount |
|---|---|---|---|
| Previous Owner | Pogatch Karen L | $215,900 |
Source: Public Records
Tax History
| Year | Tax Paid | Tax Assessment Tax Assessment Total Assessment is a certain percentage of the fair market value that is determined by local assessors to be the total taxable value of land and additions on the property. | Land | Improvement |
|---|---|---|---|---|
| 2025 | $4,661 | $447,300 | $111,900 | $335,400 |
| 2024 | $4,702 | $418,700 | $86,500 | $332,200 |
| 2023 | $4,121 | $370,800 | $78,600 | $292,200 |
| 2022 | $4,121 | $312,700 | $78,600 | $234,100 |
| 2021 | $4,044 | $300,700 | $78,600 | $222,100 |
| 2020 | $3,775 | $284,700 | $78,600 | $206,100 |
| 2019 | $3,660 | $275,400 | $73,200 | $202,200 |
| 2018 | $3,476 | $255,000 | $73,200 | $181,800 |
| 2017 | $3,266 | $242,800 | $73,200 | $169,600 |
| 2016 | $2,909 | $215,000 | $70,000 | $145,000 |
| 2015 | $2,810 | $215,000 | $70,000 | $145,000 |
| 2014 | $2,977 | $231,700 | $70,000 | $161,700 |
Source: Public Records
Map
Nearby Homes
- 437 Main St
- 110 Mayflower Ridge Dr
- 10 Longmeadow Dr
- 6 Bourne Terrace
- 2645 Cranberry Hwy Unit A
- 233 Marion Rd
- 12 Oakdale St
- 4 Mather Dr
- 7 Maud Palmer Dr
- 1 Emma Ln Unit B
- 106 Circuit Ave
- 2697 Cranberry Hwy Unit 21
- 10 Oak St
- 9 Woodville Way
- 15 14th Ave
- 2711 Cranberry Hwy
- 15 Broadmarsh Ave
- 6 Allen Ave
- 20 Grant St
- 17 Station St
Your Personal Tour Guide
Ask me questions while you tour the home.