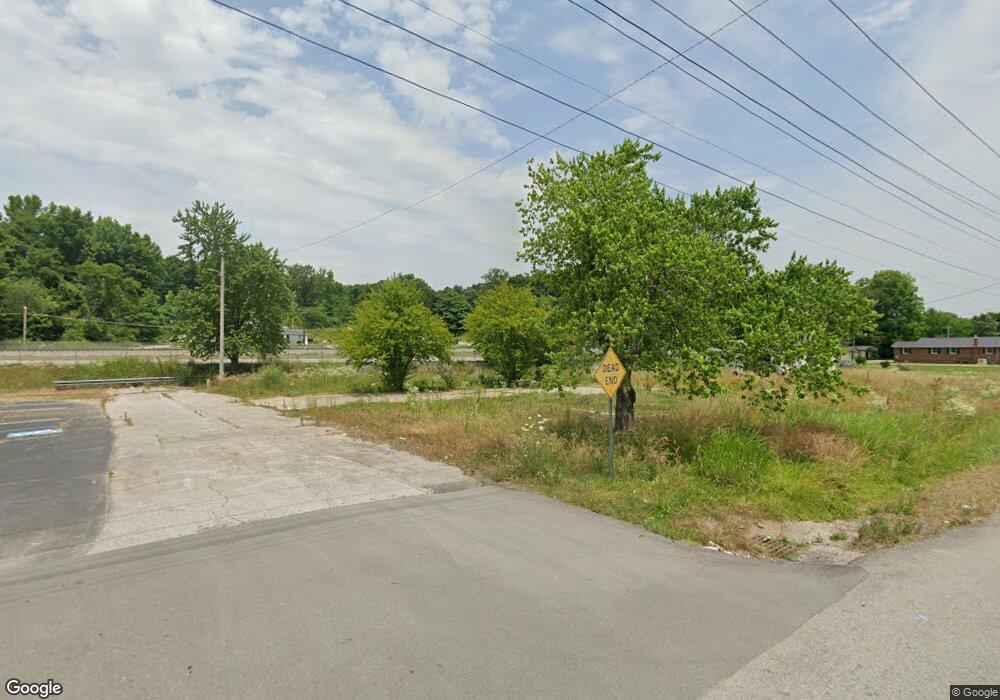
201 Luff St Waverly, TN 37185
Estimated Value: $80,000 - $134,000
Studio
1
Bath
1,533
Sq Ft
$76/Sq Ft
Est. Value
About This Home
This home is located at 201 Luff St, Waverly, TN 37185 and is currently estimated at $116,791, approximately $76 per square foot. 201 Luff St is a home located in Humphreys County.
Ownership History
Date
Name
Owned For
Owner Type
Purchase Details
Closed on
Oct 31, 2017
Sold by
Werfel Michael L
Bought by
Werfel David A
Current Estimated Value
Purchase Details
Closed on
Mar 13, 2015
Sold by
Wright Frank H
Bought by
Werfel David E
Home Financials for this Owner
Home Financials are based on the most recent Mortgage that was taken out on this home.
Original Mortgage
$37,500
Outstanding Balance
$28,754
Interest Rate
3.79%
Mortgage Type
Cash
Estimated Equity
$88,037
Purchase Details
Closed on
May 31, 2011
Sold by
Smith Jeffery R
Bought by
Wright Frank H and Wright Gail P
Purchase Details
Closed on
Mar 22, 2005
Sold by
Wright Frank H
Bought by
Smith Jeffery R
Purchase Details
Closed on
May 24, 1993
Bought by
Wright Frank H and Wright Gail P
Purchase Details
Closed on
Jun 11, 1973
Bought by
Smith James Ray and Smith Barbara B
Purchase Details
Closed on
Dec 13, 1961
Create a Home Valuation Report for This Property
The Home Valuation Report is an in-depth analysis detailing your home's value as well as a comparison with similar homes in the area
Home Values in the Area
Average Home Value in this Area
Purchase History
| Date | Buyer | Sale Price | Title Company |
|---|---|---|---|
| Werfel David A | -- | None Available | |
| Werfel David E | $50,000 | -- | |
| Wright Frank H | -- | -- | |
| Smith Jeffery R | $60,000 | -- | |
| Wright Frank H | $25,000 | -- | |
| Smith James Ray | -- | -- | |
| -- | -- | -- |
Source: Public Records
Mortgage History
| Date | Status | Borrower | Loan Amount |
|---|---|---|---|
| Open | Werfel David E | $37,500 |
Source: Public Records
Tax History Compared to Growth
Tax History
| Year | Tax Paid | Tax Assessment Tax Assessment Total Assessment is a certain percentage of the fair market value that is determined by local assessors to be the total taxable value of land and additions on the property. | Land | Improvement |
|---|---|---|---|---|
| 2025 | $64 | $2,100 | $0 | $0 |
| 2024 | $64 | $2,100 | $2,100 | $0 |
| 2023 | $64 | $2,100 | $2,100 | $0 |
| 2022 | $68 | $2,125 | $2,125 | $0 |
| 2021 | $445 | $2,125 | $2,125 | $0 |
| 2020 | $660 | $20,550 | $2,125 | $18,425 |
| 2019 | $555 | $16,850 | $2,100 | $14,750 |
| 2018 | $555 | $16,850 | $2,100 | $14,750 |
| 2017 | $555 | $16,850 | $2,100 | $14,750 |
| 2016 | $532 | $14,950 | $2,100 | $12,850 |
| 2015 | $532 | $14,950 | $2,100 | $12,850 |
| 2014 | $533 | $14,966 | $0 | $0 |
Source: Public Records
Map
Nearby Homes
- 120 Joe St
- 311 E Main St
- 206 Joe St
- 317 E Main St
- 102 N Cooley Ave
- 203 E Duffle St
- 128 Washington Cir
- 424 E Commerce St
- 212 E Main St
- 413 E Main St
- 375 Highway 13 N
- 104 Fairground Dr
- 116 Fairground Dr
- 0 Bear Hollow Dr Unit 24022394
- 0 Bear Hollow Dr Unit RTC3002566
- 0 Bear Hollow Dr Unit RTC2817194
- 0 Bear Hollow Dr Unit 24022393
- 0 Bear Hollow Dr Unit RTC2747935
- 126 Fairground Dr
- 130 Fairground Dr
