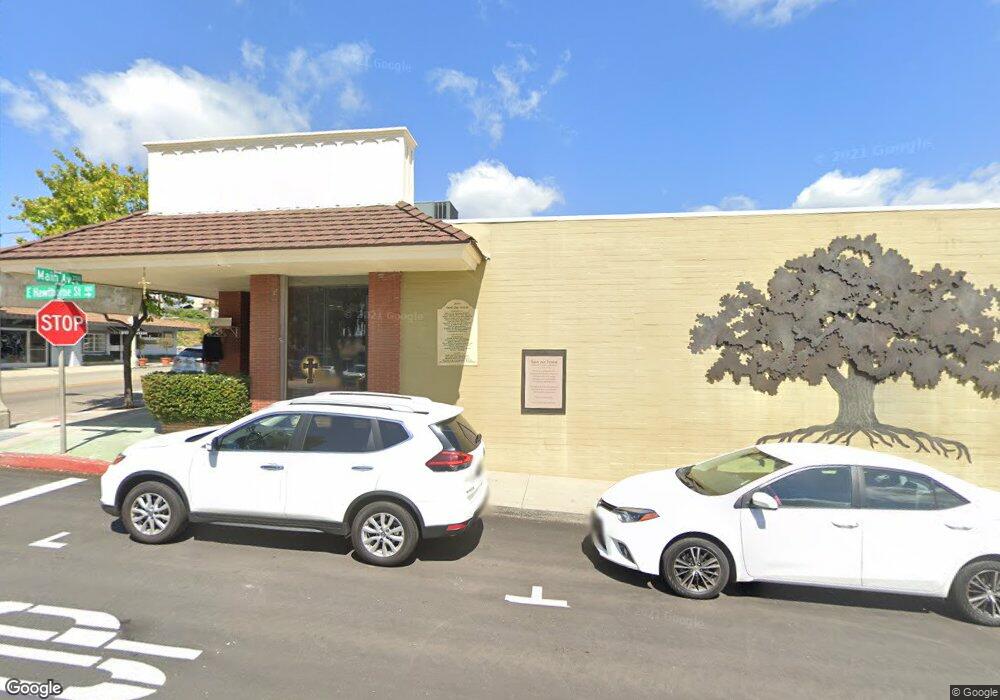
201 N Main Ave Fallbrook, CA 92028
Estimated Value: $1,562,183
Studio
--
Bath
8,065
Sq Ft
$194/Sq Ft
Est. Value
About This Home
This home is located at 201 N Main Ave, Fallbrook, CA 92028 and is currently estimated at $1,562,183, approximately $193 per square foot. 201 N Main Ave is a home located in San Diego County with nearby schools including William H. Frazier Elementary School, James E. Potter Intermediate School, and Fallbrook High School.
Ownership History
Date
Name
Owned For
Owner Type
Purchase Details
Closed on
Jul 10, 2017
Sold by
Jardell Pamela
Bought by
Caruthers Ronnie
Current Estimated Value
Purchase Details
Closed on
Jan 19, 2012
Sold by
Ardell Pamela J
Bought by
Ardell Pamela J
Purchase Details
Closed on
Oct 31, 2011
Sold by
Parry Walter T and Parry Karen A
Bought by
Parry Walter Tillman and Parry Karen Allen
Purchase Details
Closed on
Sep 11, 2008
Sold by
Parry Karen A and Ardell Pamela J
Bought by
Parry Karen A and Ardell Pamela J
Purchase Details
Closed on
Mar 31, 2006
Sold by
Ardell Pamela J
Bought by
Ardell Pamela J
Purchase Details
Closed on
Jan 13, 1998
Sold by
Allen Robert Y
Bought by
Parry Karen A and Ardell Pamela J
Purchase Details
Closed on
Nov 3, 1997
Sold by
Parry Karen
Bought by
Ardell Pamela J
Create a Home Valuation Report for This Property
The Home Valuation Report is an in-depth analysis detailing your home's value as well as a comparison with similar homes in the area
Home Values in the Area
Average Home Value in this Area
Purchase History
| Date | Buyer | Sale Price | Title Company |
|---|---|---|---|
| Caruthers Ronnie | $975,000 | First American Title Company | |
| Ardell Pamela J | -- | None Available | |
| Ardell Pamela J | -- | None Available | |
| Parry Walter Tillman | -- | None Available | |
| Parry Walter T | -- | None Available | |
| Parry Karen A | -- | None Available | |
| Ardell Pamela J | -- | None Available | |
| Ardell Pamela J | -- | None Available | |
| Parry Karen A | -- | -- | |
| Ardell Pamela J | -- | -- |
Source: Public Records
Tax History
| Year | Tax Paid | Tax Assessment Tax Assessment Total Assessment is a certain percentage of the fair market value that is determined by local assessors to be the total taxable value of land and additions on the property. | Land | Improvement |
|---|---|---|---|---|
| 2025 | $11,657 | $1,109,378 | $329,967 | $779,411 |
| 2024 | $11,657 | $1,087,627 | $323,498 | $764,129 |
| 2023 | $11,303 | $1,066,302 | $317,155 | $749,147 |
| 2022 | $11,303 | $1,045,395 | $310,937 | $734,458 |
| 2021 | $10,929 | $1,024,898 | $304,841 | $720,057 |
| 2020 | $11,019 | $1,014,390 | $301,716 | $712,674 |
| 2019 | $10,806 | $994,500 | $295,800 | $698,700 |
| 2018 | $10,643 | $975,000 | $290,000 | $685,000 |
| 2017 | $1,821 | $162,596 | $73,831 | $88,765 |
| 2016 | $1,854 | $159,409 | $72,384 | $87,025 |
| 2015 | $1,774 | $157,015 | $71,297 | $85,718 |
| 2014 | $1,742 | $153,940 | $69,901 | $84,039 |
Source: Public Records
Map
Nearby Homes
- 408 N Pico Ave
- 0 Via Vonnie Unit SW26054903
- 210 S Orange Ave
- 502 E Elder St
- 214 Summit Ave
- 275 Royal Glen Dr
- 522 S Pico Ave
- 678 Robby Way
- 842 Porter Way
- 741 Rossiter Ln
- 1006 N Orange Ave
- 508 Village View Place
- 868 E Alvarado St Unit 7
- 868 E Alvarado St Unit 47
- 535 Shady Glen Dr
- 1024 Kiel Rd
- 1120 E Mission Rd Unit 33
- 1120 E Mission Rd Unit 39
- 1120 E Mission Rd Unit 44
- 1120 E Mission Rd Unit 22
- 205 N Main Ave
- 201 - 205 201 - 205 N Main
- 201 - 205 N Main
- 127 N Main Ave
- 127 N Main Ave Unit 133
- 115 E Hawthorne St
- 123 N Main Ave
- 119 N Main Ave
- 231 N Main Ave
- 115 N Main Ave
- 118 N Main Ave
- 110 N Main Ave
- 140 W Hawthorne St
- 121 N Pico Ave
- 237 N Mission Rd
- 123 E Alvarado St
- 300 N Main Ave
- 119 119 E Alvarado St
- 119 E Alvarado St
- 119-125 119-125 E Alvarado St
Your Personal Tour Guide
Ask me questions while you tour the home.