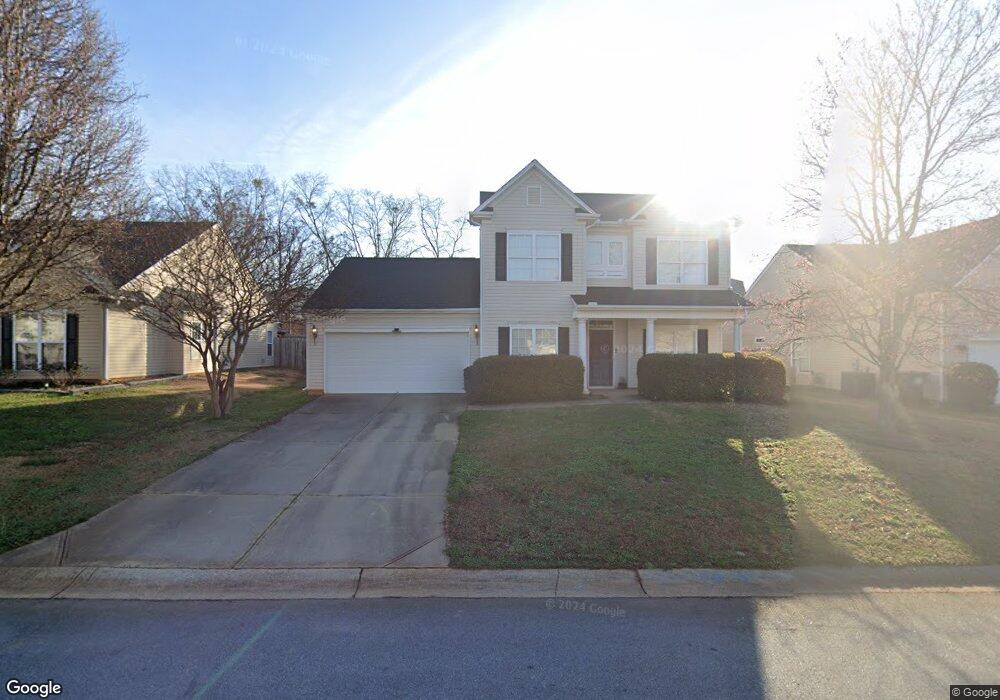
201 S Musgrove Ln Duncan, SC 29334
Estimated Value: $297,158 - $323,000
4
Beds
3
Baths
2,053
Sq Ft
$151/Sq Ft
Est. Value
About This Home
This home is located at 201 S Musgrove Ln, Duncan, SC 29334 and is currently estimated at $310,540, approximately $151 per square foot. 201 S Musgrove Ln is a home located in Spartanburg County with nearby schools including Abner Creek Academy, Byrnes Freshman Academy, and Berry Shoals Intermediate School.
Ownership History
Date
Name
Owned For
Owner Type
Purchase Details
Closed on
Dec 12, 2018
Sold by
Harling Julie R
Bought by
Harpe Heather R
Current Estimated Value
Purchase Details
Closed on
Oct 22, 2010
Sold by
Winkler Terry M and Winkler Pamela A
Bought by
Harling Julie R and Harpe Heather R
Home Financials for this Owner
Home Financials are based on the most recent Mortgage that was taken out on this home.
Original Mortgage
$135,276
Interest Rate
4.87%
Mortgage Type
FHA
Purchase Details
Closed on
Jan 15, 2009
Sold by
Federal National Mortgage Association
Bought by
Winkler Pamela A and Winkler Terry M
Purchase Details
Closed on
Oct 20, 2008
Sold by
Mercedes Yosemis and Perez Daniel
Bought by
Federal National Mortgage Association
Purchase Details
Closed on
May 30, 2003
Sold by
The Ryland Group Inc
Bought by
Knight Lamar Edward and Knight Kathryn Hill
Create a Home Valuation Report for This Property
The Home Valuation Report is an in-depth analysis detailing your home's value as well as a comparison with similar homes in the area
Home Values in the Area
Average Home Value in this Area
Purchase History
| Date | Buyer | Sale Price | Title Company |
|---|---|---|---|
| Harpe Heather R | -- | None Available | |
| Harling Julie R | $147,000 | -- | |
| Winkler Pamela A | $115,525 | -- | |
| Federal National Mortgage Association | $170,287 | -- | |
| Knight Lamar Edward | $154,614 | -- |
Source: Public Records
Mortgage History
| Date | Status | Borrower | Loan Amount |
|---|---|---|---|
| Previous Owner | Harling Julie R | $135,276 |
Source: Public Records
Tax History Compared to Growth
Tax History
| Year | Tax Paid | Tax Assessment Tax Assessment Total Assessment is a certain percentage of the fair market value that is determined by local assessors to be the total taxable value of land and additions on the property. | Land | Improvement |
|---|---|---|---|---|
| 2025 | $4,327 | $12,131 | $2,042 | $10,089 |
| 2024 | $4,327 | $12,131 | $2,042 | $10,089 |
| 2023 | $4,327 | $12,131 | $2,042 | $10,089 |
| 2022 | $3,982 | $10,548 | $1,560 | $8,988 |
| 2021 | $3,982 | $10,548 | $1,560 | $8,988 |
| 2020 | $3,953 | $10,548 | $1,560 | $8,988 |
| 2019 | $3,949 | $6,661 | $985 | $5,676 |
| 2018 | $1,030 | $6,661 | $985 | $5,676 |
| 2017 | $891 | $5,792 | $1,040 | $4,752 |
| 2016 | $859 | $5,792 | $1,040 | $4,752 |
| 2015 | $835 | $5,792 | $1,040 | $4,752 |
| 2014 | $836 | $5,792 | $1,040 | $4,752 |
Source: Public Records
Map
Nearby Homes
- 1011 Rogers Bridge Rd
- 253 Golden Bear Walk
- 408 Royalston Ct
- 624 S Morningwood Ln
- 737 Stilmore Dr
- 1055 Summerlin Trail
- 344 Lansdowne St
- 714 Thistlewood Dr
- 638 Grantleigh Dr
- 254 Twilitemist Dr
- 3048 Olivette Place
- 3052 Olivette Place
- 3025 Olivette Place
- 820 Redmill Ln
- 141 Agnes Dr
- 1312 Duncan Reidville Rd
- 636 Sunwater Dr
- 644 Diamond Ridge Way
- 147 Bearden Dr
- 159 Rockingham Rd
- 402 N Musgrove Ln
- 437 Saddleback Trail
- 441 Saddleback Trail
- 406 N Musgrove Ln
- 209 S Musgrove Ln
- 316 Nightshade Ln
- 315 Nightshade Ln
- 433 Saddleback Trail
- 213 S Musgrove Ln
- 410 N Musgrove Ln
- 440 Saddleback Trail
- 312 Nightshade Ln
- 311 Nightshade Ln
- 117 Prairie Wolf Run
- 210 S Musgrove Ln
- 429 Saddleback Trail
- 409 N Musgrove Ln
- 105 Prairie Wolf Run
- 217 S Musgrove Ln
- 436 Saddleback Trail