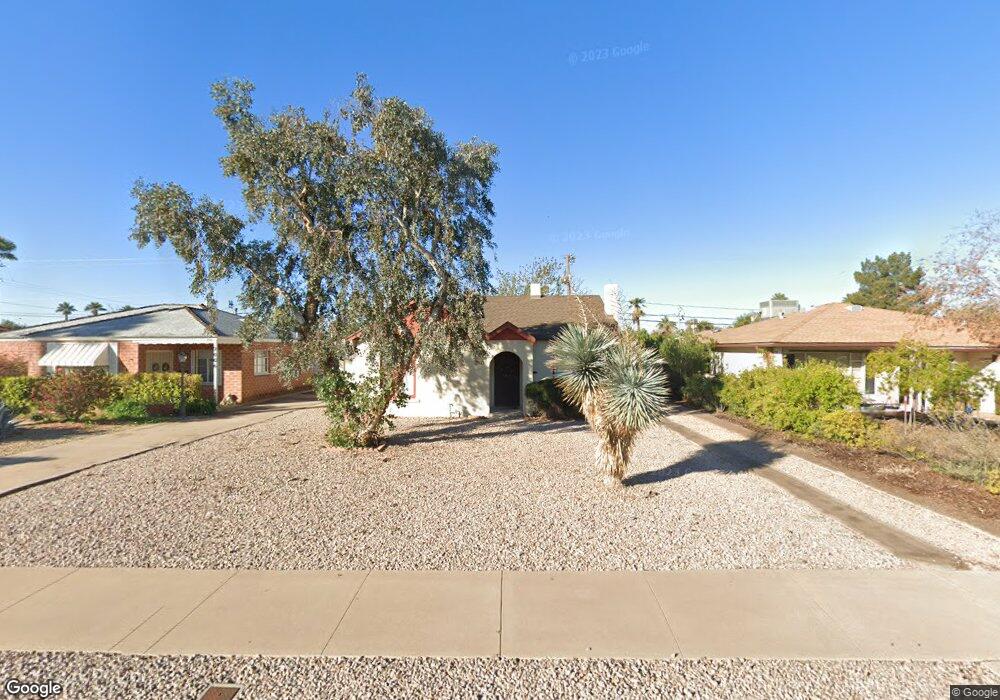
2010 N Laurel Ave Phoenix, AZ 85007
Encanto-Palmcroft NeighborhoodEstimated Value: $418,158 - $523,000
--
Bed
1
Bath
1,056
Sq Ft
$443/Sq Ft
Est. Value
About This Home
This home is located at 2010 N Laurel Ave, Phoenix, AZ 85007 and is currently estimated at $467,540, approximately $442 per square foot. 2010 N Laurel Ave is a home located in Maricopa County with nearby schools including Maie Bartlett Heard Elementary School, Phoenix Coding Academy, and Central High School.
Ownership History
Date
Name
Owned For
Owner Type
Purchase Details
Closed on
Nov 15, 2013
Sold by
Hegre Keri
Bought by
Hensley Keri
Current Estimated Value
Purchase Details
Closed on
Jul 12, 2013
Sold by
Hegre Benjamin T
Bought by
Hegre Keri
Purchase Details
Closed on
Mar 11, 2003
Sold by
Silverado Equities Inc
Bought by
Hegre Benjamin T and Hegre Keri
Home Financials for this Owner
Home Financials are based on the most recent Mortgage that was taken out on this home.
Original Mortgage
$130,500
Interest Rate
5.82%
Mortgage Type
New Conventional
Purchase Details
Closed on
Nov 11, 2002
Sold by
Velasquez Rebekah J and Jasso Rebekah
Bought by
Silverado Equities Inc
Create a Home Valuation Report for This Property
The Home Valuation Report is an in-depth analysis detailing your home's value as well as a comparison with similar homes in the area
Home Values in the Area
Average Home Value in this Area
Purchase History
| Date | Buyer | Sale Price | Title Company |
|---|---|---|---|
| Hensley Keri | -- | None Available | |
| Hegre Keri | -- | None Available | |
| Hegre Benjamin T | $145,000 | American Title Ins Agency Az | |
| Silverado Equities Inc | $80,000 | Century Title Agency Inc |
Source: Public Records
Mortgage History
| Date | Status | Borrower | Loan Amount |
|---|---|---|---|
| Previous Owner | Hegre Benjamin T | $130,500 |
Source: Public Records
Tax History Compared to Growth
Tax History
| Year | Tax Paid | Tax Assessment Tax Assessment Total Assessment is a certain percentage of the fair market value that is determined by local assessors to be the total taxable value of land and additions on the property. | Land | Improvement |
|---|---|---|---|---|
| 2025 | $757 | $5,328 | -- | -- |
| 2024 | $706 | $5,074 | -- | -- |
| 2023 | $706 | $16,600 | $3,320 | $13,280 |
| 2022 | $680 | $13,115 | $2,620 | $10,495 |
| 2021 | $675 | $11,885 | $2,375 | $9,510 |
| 2020 | $683 | $11,285 | $2,255 | $9,030 |
| 2019 | $682 | $9,490 | $1,895 | $7,595 |
| 2018 | $670 | $8,910 | $1,780 | $7,130 |
| 2017 | $655 | $8,015 | $1,600 | $6,415 |
| 2016 | $636 | $6,990 | $1,395 | $5,595 |
| 2015 | $589 | $5,560 | $1,110 | $4,450 |
Source: Public Records
Map
Nearby Homes
- 2230 N Laurel Ave
- 2230 N 16th Ave
- 1842 N 17th Ave
- 2257 N 16th Ave
- 1706 N 17th Ave
- 1551 W Vernon Ave
- 1621 N 16th Ave
- 1808 N 13th Ave
- 1552 W Mcdowell Rd
- 1625 Palmcroft Way SW
- 1609 W Lewis Ave
- 2209 N 12th Ave
- 2020 N 11th Ave
- 1615 Palmcroft Way SE
- 1515 N 15th Ave
- 1514 W Lynwood St
- 1614 Palmcroft Way SE
- 1902 W Granada Rd
- 1910 W Holly St
- 1629 W Willetta St
- 2014 N Laurel Ave
- 2006 N Laurel Ave
- 1530 W Palm Ln
- 2018 N Laurel Ave
- 1530 W Palm Ln
- 2022 N Laurel Ave
- 2009 N 16th Ave
- 2005 N 16th Ave
- 2013 N 16th Ave
- 2015 N 16th Ave
- 1590 W Palm Ln
- 2009 N Laurel Ave
- 2013 N Laurel Ave
- 2026 N Laurel Ave
- 2005 N Laurel Ave
- 1850 N Laurel Ave
- 2001 N Laurel Ave
- 2021 N 16th Ave
- 2021 N Laurel Ave
- 2030 N Laurel Ave