


2011 85th Street Ct E Tacoma, WA 98445
Midland NeighborhoodEstimated payment $2,944/month
Highlights
- Clubhouse
- Contemporary Architecture
- Cul-De-Sac
- Deck
- Walk-In Pantry
- 2 Car Attached Garage
About This Home
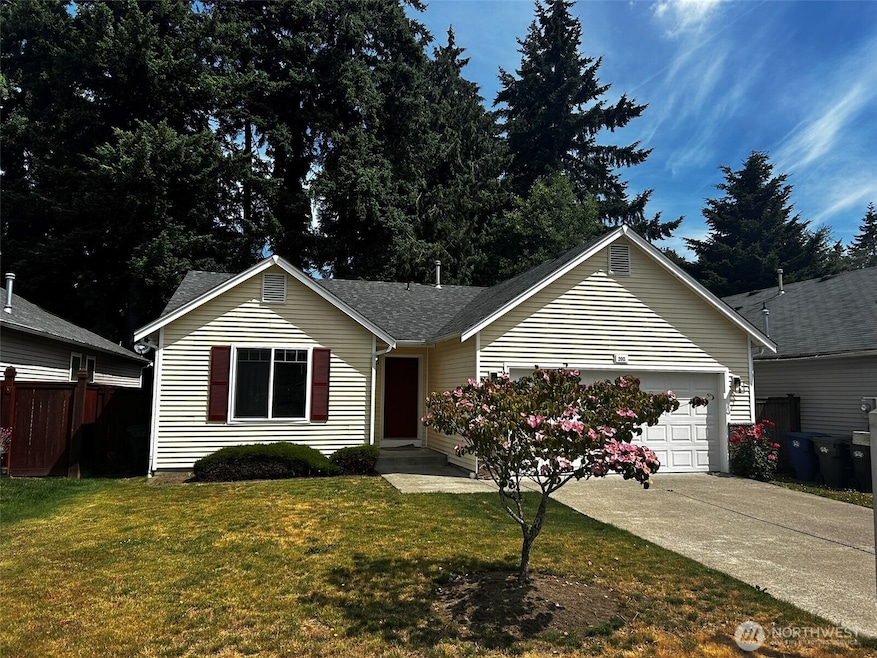
Price Drop!!! Don't miss your opportunity to own this remodeled home with modern touches. Featuring 3 large bedrooms, 2 full baths, and a great living room that is open to the kitchen and dining areas. The stunning remodel has been meticulously curated with matching finishes, fixtures, quartz counters in kitchen and both baths, waterproof LVP flooring and new carpet in bedrooms. This home is situated in a well established neighborhood that features a little park and free little library. The home and neighborhood are centrally located and close to I-5 and 512. Don't let this one slip away! Preferred lender incentive call broker for details.

Source: Northwest Multiple Listing Service (NWMLS)
MLS#: 2395115
Home Details
Home Type
- Single Family
Est. Annual Taxes
- $4,145
Year Built
- Built in 2005
Lot Details
- 4,742 Sq Ft Lot
- Cul-De-Sac
- Property is Fully Fenced
- Property is in very good condition
HOA Fees
- $21 Monthly HOA Fees
Parking
- 2 Car Attached Garage
Home Design
- Contemporary Architecture
- Poured Concrete
- Composition Roof
- Metal Construction or Metal Frame
- Vinyl Construction Material
Interior Spaces
- 1,505 Sq Ft Home
- 1-Story Property
- French Doors
- Dining Room
- Storm Windows
Kitchen
- Walk-In Pantry
- Stove
- Dishwasher
Bedrooms and Bathrooms
- 3 Main Level Bedrooms
- Walk-In Closet
- Bathroom on Main Level
- 2 Full Bathrooms
Outdoor Features
- Deck
- Patio
Utilities
- Forced Air Heating System
- Cable TV Available
Listing and Financial Details
- Down Payment Assistance Available
- Visit Down Payment Resource Website
- Assessor Parcel Number 5003420160
Community Details
Overview
- Parkland Subdivision
Amenities
- Clubhouse
Map
Home Values in the Area
Average Home Value in this Area
Tax History
| Year | Tax Paid | Tax Assessment Tax Assessment Total Assessment is a certain percentage of the fair market value that is determined by local assessors to be the total taxable value of land and additions on the property. | Land | Improvement |
|---|---|---|---|---|
| 2025 | $4,465 | $421,700 | $148,700 | $273,000 |
| 2024 | $4,465 | $397,600 | $148,700 | $248,900 |
| 2023 | $4,465 | $382,400 | $148,700 | $233,700 |
| 2022 | $4,145 | $399,200 | $140,800 | $258,400 |
| 2021 | $3,715 | $277,300 | $83,300 | $194,000 |
| 2019 | $2,995 | $257,300 | $74,300 | $183,000 |
| 2018 | $3,553 | $231,400 | $66,200 | $165,200 |
| 2017 | $3,382 | $210,100 | $52,500 | $157,600 |
| 2016 | $3,015 | $178,500 | $42,600 | $135,900 |
| 2014 | $2,685 | $160,400 | $36,800 | $123,600 |
| 2013 | $2,685 | $145,900 | $34,700 | $111,200 |
Property History
| Date | Event | Price | List to Sale | Price per Sq Ft |
|---|---|---|---|---|
| 11/24/2025 11/24/25 | Pending | -- | -- | -- |
| 11/21/2025 11/21/25 | Price Changed | $490,000 | -1.0% | $326 / Sq Ft |
| 11/04/2025 11/04/25 | Price Changed | $495,000 | -1.0% | $329 / Sq Ft |
| 10/11/2025 10/11/25 | Price Changed | $499,900 | -2.9% | $332 / Sq Ft |
| 10/01/2025 10/01/25 | Price Changed | $515,000 | -2.8% | $342 / Sq Ft |
| 09/18/2025 09/18/25 | Price Changed | $530,000 | -0.9% | $352 / Sq Ft |
| 09/07/2025 09/07/25 | Price Changed | $534,900 | -2.6% | $355 / Sq Ft |
| 08/05/2025 08/05/25 | Price Changed | $549,000 | -3.5% | $365 / Sq Ft |
| 07/10/2025 07/10/25 | Price Changed | $569,000 | -1.0% | $378 / Sq Ft |
| 06/20/2025 06/20/25 | Price Changed | $574,900 | +4.5% | $382 / Sq Ft |
| 06/19/2025 06/19/25 | For Sale | $549,900 | -- | $365 / Sq Ft |
Purchase History
| Date | Type | Sale Price | Title Company |
|---|---|---|---|
| Quit Claim Deed | $425,000 | None Listed On Document | |
| Warranty Deed | $239,989 | Ticor Title Of Wa Inc |
Mortgage History
| Date | Status | Loan Amount | Loan Type |
|---|---|---|---|
| Open | $385,000 | Seller Take Back | |
| Previous Owner | $191,992 | Fannie Mae Freddie Mac |
Source: Northwest Multiple Listing Service (NWMLS)
MLS Number: 2395115
APN: 500342-0160
Disclaimer: Certain information contained herein is derived from information provided by parties other than Homes.com. All information provided is deemed reliable, but is not guaranteed to be accurate and should be independently verified.
![]() All data is obtained from various sources and may not have been verified by broker or MLS GRID. Supplied Open House Information is subject to change without notice. All information should be independently reviewed and verified for accuracy. Properties may or may not be listed by the office/agent presenting the information. Listing information is provided by the Northwest Multiple Listing Service (NWMLS). Property information is based on available data that may include MLS information, county records, and other sources. Listings marked with the 3 tree icon and provided by NWMLS. All properties are subject to prior sale or withdrawal. IDX information is provided exclusively for consumers’ personal noncommercial use, that it may not be used for any purpose other than to identify prospective properties consumers may be interested in purchasing, that the data is deemed reliable but is not guaranteed by MLS GRID. ©2025 NWMLS.
All data is obtained from various sources and may not have been verified by broker or MLS GRID. Supplied Open House Information is subject to change without notice. All information should be independently reviewed and verified for accuracy. Properties may or may not be listed by the office/agent presenting the information. Listing information is provided by the Northwest Multiple Listing Service (NWMLS). Property information is based on available data that may include MLS information, county records, and other sources. Listings marked with the 3 tree icon and provided by NWMLS. All properties are subject to prior sale or withdrawal. IDX information is provided exclusively for consumers’ personal noncommercial use, that it may not be used for any purpose other than to identify prospective properties consumers may be interested in purchasing, that the data is deemed reliable but is not guaranteed by MLS GRID. ©2025 NWMLS.
Based on information submitted to the MLS GRID
- 8311 19th Avenue Ct E Unit 27
- 2014 88th St E
- 13923 17th St E Unit 51
- 8507 13th Ave E
- 7810 25th Ave E
- 2003 77th Street Ct E
- 2005 77th Street Ct E
- Mercer Plan at Eagle Landing
- Hawthorn Plan at Eagle Landing
- 8519 Golden Given Rd E
- 1821 75th St E Unit 5
- 7426 Portland Ave E
- 1706 73rd St E Unit 15
- 9607 24th Ave E
- 7802 Golden Given Rd E
- 7704 Golden Given Rd E
- 8212 8th Avenue Ct E Unit 1
- 1013 1015 76th Street Ct E Unit 1-8
- 9711 12th Avenue Ct E Unit 1
- 7918 Mckinley Ave