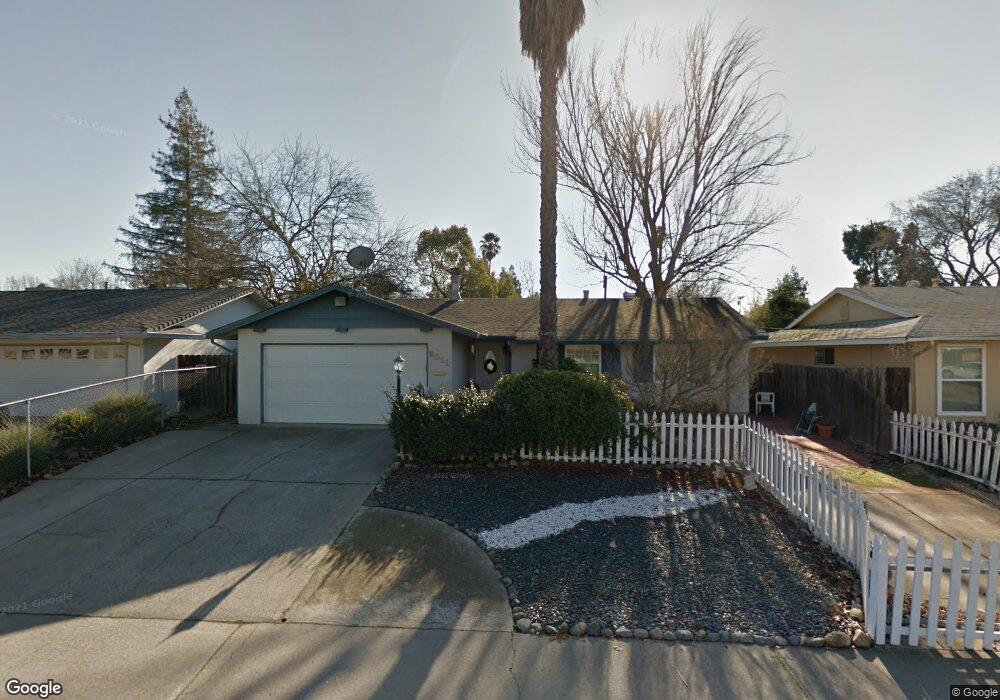
2011 Kellogg Way Rancho Cordova, CA 95670
Mills Ranch NeighborhoodEstimated Value: $316,000 - $456,000
3
Beds
2
Baths
1,170
Sq Ft
$353/Sq Ft
Est. Value
About This Home
This home is located at 2011 Kellogg Way, Rancho Cordova, CA 95670 and is currently estimated at $413,078, approximately $353 per square foot. 2011 Kellogg Way is a home located in Sacramento County with nearby schools including Riverview STEM Elementary School, Peter J. Shields Elementary School, and W.E. Mitchell Middle School.
Ownership History
Date
Name
Owned For
Owner Type
Purchase Details
Closed on
Mar 22, 2004
Sold by
Thurmon John M and Thurmon Lynn M
Bought by
Greenan Matthew and Greenan Carol
Current Estimated Value
Home Financials for this Owner
Home Financials are based on the most recent Mortgage that was taken out on this home.
Original Mortgage
$202,400
Outstanding Balance
$93,930
Interest Rate
5.57%
Mortgage Type
Purchase Money Mortgage
Estimated Equity
$319,148
Purchase Details
Closed on
May 19, 2002
Sold by
Watson Mark C and Watson Carmen R
Bought by
Thurmon John M and Thurmon Lynn M
Home Financials for this Owner
Home Financials are based on the most recent Mortgage that was taken out on this home.
Original Mortgage
$190,213
Interest Rate
6.94%
Mortgage Type
FHA
Create a Home Valuation Report for This Property
The Home Valuation Report is an in-depth analysis detailing your home's value as well as a comparison with similar homes in the area
Home Values in the Area
Average Home Value in this Area
Purchase History
| Date | Buyer | Sale Price | Title Company |
|---|---|---|---|
| Greenan Matthew | $253,000 | Chicago Title Co | |
| Thurmon John M | $193,000 | Alliance Title Company |
Source: Public Records
Mortgage History
| Date | Status | Borrower | Loan Amount |
|---|---|---|---|
| Open | Greenan Matthew | $202,400 | |
| Previous Owner | Thurmon John M | $190,213 |
Source: Public Records
Tax History Compared to Growth
Tax History
| Year | Tax Paid | Tax Assessment Tax Assessment Total Assessment is a certain percentage of the fair market value that is determined by local assessors to be the total taxable value of land and additions on the property. | Land | Improvement |
|---|---|---|---|---|
| 2025 | $4,777 | $359,691 | $99,514 | $260,177 |
| 2024 | $4,777 | $352,639 | $97,563 | $255,076 |
| 2023 | $4,050 | $345,725 | $95,650 | $250,075 |
| 2022 | $3,999 | $338,947 | $93,775 | $245,172 |
| 2021 | $3,920 | $332,302 | $91,937 | $240,365 |
| 2020 | $3,895 | $328,896 | $90,995 | $237,901 |
| 2019 | $3,831 | $322,448 | $89,211 | $233,237 |
| 2018 | $3,731 | $316,126 | $87,462 | $228,664 |
| 2017 | $3,226 | $300,415 | $83,116 | $217,299 |
| 2016 | $3,138 | $265,854 | $73,554 | $192,300 |
| 2015 | $2,744 | $241,687 | $66,868 | $174,819 |
| 2014 | $2,810 | $228,007 | $63,083 | $164,924 |
Source: Public Records
Map
Nearby Homes
- 10872 Oakton Way
- 1920 Benita Dr
- 1977 Benita Dr Unit 1
- 10835 Coloma Rd Unit 3
- 2200 Kimwood Ln
- 2255 El Manto Dr
- 2256 Ramo Ct
- 2337 Benita Dr
- 2352 Sonata Dr
- 2329 Mcgregor Dr
- 2404 Coolidge Way
- 11100 Trinity River Dr
- 11150 Trinity River Dr Unit 41
- 11150 Trinity River Dr
- 11150 Trinity River Dr Unit 59
- 10825 Walnutwood Way
- 259 Rocky Hills Ln
- 2413 Cordova Ln
- 27 Golden Inn Way
- 311 Sunny Hills Dr
- 2007 Kellogg Way
- 2015 Kellogg Way
- 10837 Oakton Way
- 10833 Oakton Way
- 2019 Kellogg Way
- 2001 Kellogg Way
- 10841 Oakton Way
- 10829 Oakton Way
- 2016 Kellogg Way
- 2012 Kellogg Way
- 2020 Kellogg Way
- 2023 Kellogg Way
- 10825 Oakton Way
- 10845 Oakton Way
- 2024 Kellogg Way
- 2000 Kellogg Way
- 2027 Kellogg Way
- 10821 Oakton Way
- 2028 Kellogg Way
- 10836 Oakton Way