20110 Oyster Catcher Loop Bodega Bay, CA 94923
Estimated Value: $1,561,000 - $1,924,000
4
Beds
3
Baths
2,327
Sq Ft
$754/Sq Ft
Est. Value
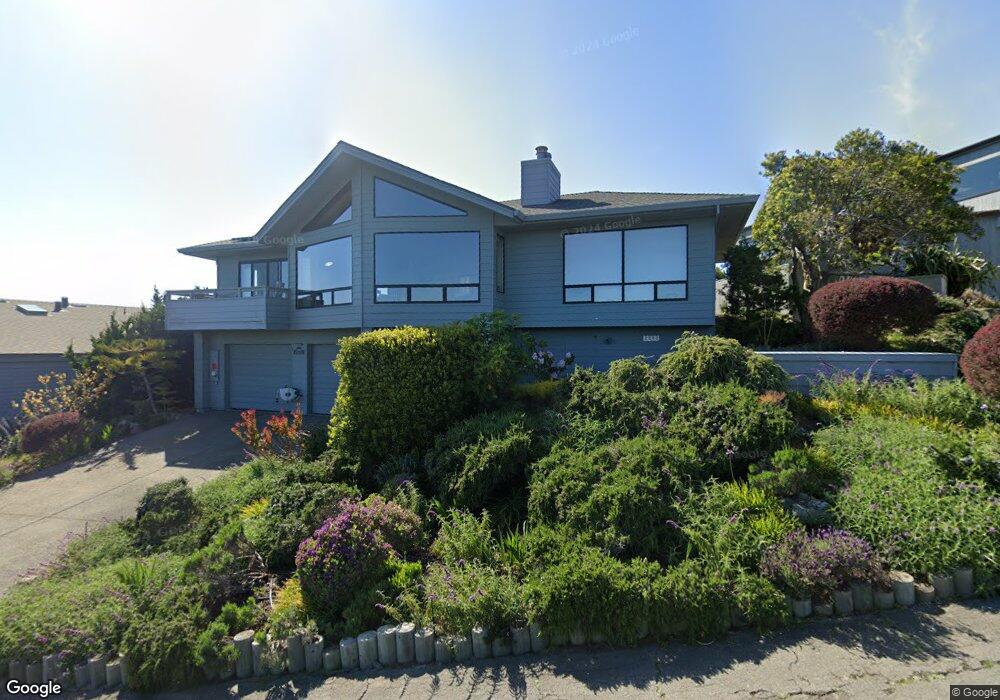
About This Home
This home is located at 20110 Oyster Catcher Loop, Bodega Bay, CA 94923 and is currently estimated at $1,754,660, approximately $754 per square foot. 20110 Oyster Catcher Loop is a home located in Sonoma County with nearby schools including Bodega Bay Elementary School and Tomales High School.
Ownership History
Date
Name
Owned For
Owner Type
Purchase Details
Closed on
Jul 23, 2012
Sold by
Stewart Gary A and Stewart Twyla J
Bought by
Tucker Tommy and Tucker Prudence Ann
Current Estimated Value
Purchase Details
Closed on
Jun 23, 2005
Sold by
Brown Raymond M and Gorman Sarah M
Bought by
Stewart Gary A and Stewart Twyla J
Purchase Details
Closed on
Apr 1, 2002
Sold by
Simpson William S and Simpson Jane C
Bought by
Brown Raymond M and Gorman Sarah M
Home Financials for this Owner
Home Financials are based on the most recent Mortgage that was taken out on this home.
Original Mortgage
$540,000
Interest Rate
6.75%
Purchase Details
Closed on
Oct 14, 1993
Sold by
Worl Mary K
Bought by
Simpson William S and Simpson Jane C
Home Financials for this Owner
Home Financials are based on the most recent Mortgage that was taken out on this home.
Original Mortgage
$112,500
Interest Rate
6.81%
Mortgage Type
Seller Take Back
Create a Home Valuation Report for This Property
The Home Valuation Report is an in-depth analysis detailing your home's value as well as a comparison with similar homes in the area
Home Values in the Area
Average Home Value in this Area
Purchase History
| Date | Buyer | Sale Price | Title Company |
|---|---|---|---|
| Tucker Tommy | $782,000 | Fidelity National Title Co | |
| Stewart Gary A | $1,105,000 | North American Title Co | |
| Brown Raymond M | $675,000 | North American Title Co Inc | |
| Simpson William S | $384,500 | Old Republic Title Company |
Source: Public Records
Mortgage History
| Date | Status | Borrower | Loan Amount |
|---|---|---|---|
| Previous Owner | Brown Raymond M | $540,000 | |
| Previous Owner | Simpson William S | $112,500 |
Source: Public Records
Tax History
| Year | Tax Paid | Tax Assessment Tax Assessment Total Assessment is a certain percentage of the fair market value that is determined by local assessors to be the total taxable value of land and additions on the property. | Land | Improvement |
|---|---|---|---|---|
| 2025 | $10,684 | $962,967 | $385,432 | $577,535 |
| 2024 | $10,684 | $944,086 | $377,875 | $566,211 |
| 2023 | $10,684 | $925,575 | $370,466 | $555,109 |
| 2022 | $10,356 | $907,427 | $363,202 | $544,225 |
| 2021 | $10,445 | $889,635 | $356,081 | $533,554 |
| 2020 | $10,466 | $880,514 | $352,430 | $528,084 |
| 2019 | $10,350 | $863,250 | $345,520 | $517,730 |
| 2018 | $10,130 | $846,325 | $338,746 | $507,579 |
| 2017 | $9,886 | $829,731 | $332,104 | $497,627 |
| 2016 | $9,736 | $813,463 | $325,593 | $487,870 |
| 2015 | -- | $801,245 | $320,703 | $480,542 |
| 2014 | -- | $785,550 | $314,421 | $471,129 |
Source: Public Records
Map
Nearby Homes
- 20007 Oyster Catcher Loop
- 1011 Sea Eagle Loop
- 590 Swan Dr
- 424 Loon Ct
- 20690 Mockingbird Rd
- 301 Sanderling Ct
- 300 Sanderling Ct
- 21002 Heron Dr
- 221 Condor Ct
- 21468 Heron Dr
- 6083 California 1
- 2100 California 1
- 1968 Sea Way
- 315 Mainsail Dr
- 2025 Dubloon Ct
- 150 Cypress Loop
- 1536 Sea Way
- 1513 Sea Way
- 153 Harbor View Way
- 140 Kent Ave
- 20100 Oyster Catcher Loop
- 20120 Oyster Catcher Loop
- 20090 Oyster Catcher Loop
- 20080 Oyster Catcher Loop
- 19902 Oyster Catcher Loop
- 19930 Oyster Catcher Loop
- 20145 Oyster Catcher Loop
- 20075 Oyster Catcher Loop
- 20060 Oyster Catcher Loop
- 19934 Oyster Catcher Loop
- 1162 Plover Ct
- 1174 Plover Ct
- 20156 Oyster Catcher Loop
- 20069 Oyster Catcher Loop
- 20050 Oyster Catcher Loop
- 20157 Osprey Dr
- 19942 Oyster Catcher Loop
- 20040 Oyster Catcher Loop
- 20164 Osprey Dr
Your Personal Tour Guide
Ask me questions while you tour the home.