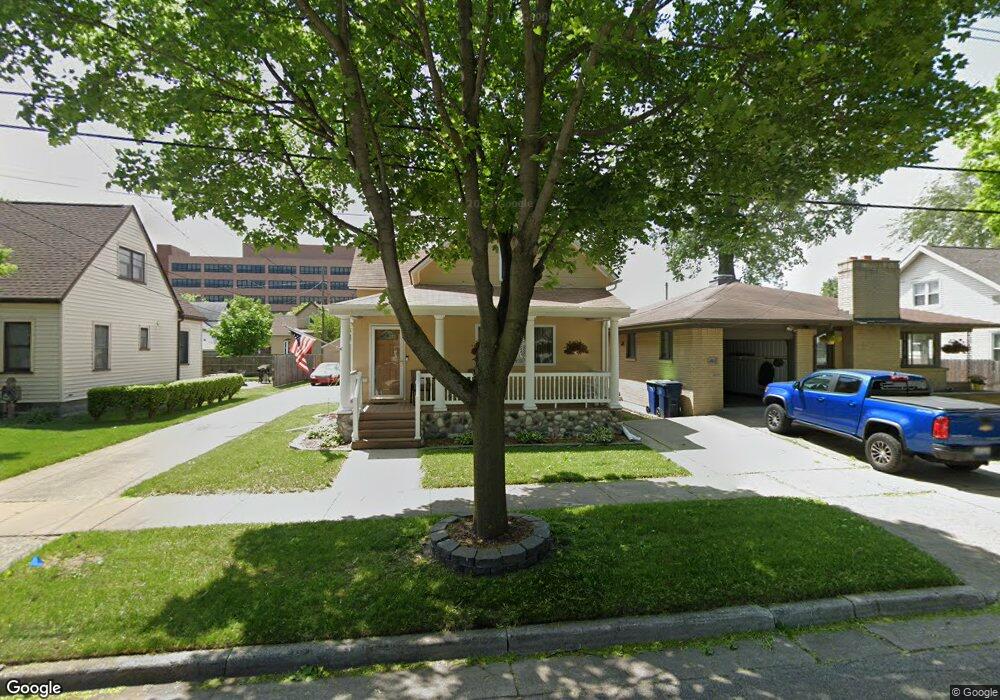
2012 11th St Bay City, MI 48708
Estimated Value: $101,000 - $130,000
4
Beds
1
Bath
1,506
Sq Ft
$77/Sq Ft
Est. Value
About This Home
This home is located at 2012 11th St, Bay City, MI 48708 and is currently estimated at $115,762, approximately $76 per square foot. 2012 11th St is a home located in Bay County with nearby schools including Washington Elementary School, Handy Middle School, and Bay City Central High School.
Ownership History
Date
Name
Owned For
Owner Type
Purchase Details
Closed on
Jan 16, 2003
Sold by
Anderson Ronald J and Anderson Aileen E
Bought by
Struthers Kevin L and Struthers Cheryl A
Current Estimated Value
Home Financials for this Owner
Home Financials are based on the most recent Mortgage that was taken out on this home.
Original Mortgage
$80,000
Outstanding Balance
$34,253
Interest Rate
6.07%
Mortgage Type
Purchase Money Mortgage
Estimated Equity
$81,509
Purchase Details
Closed on
Jun 27, 1996
Sold by
Anderson Ronald J and Anderson Aileen E
Bought by
Struthers Kevin L and Struthers Cheryl A
Create a Home Valuation Report for This Property
The Home Valuation Report is an in-depth analysis detailing your home's value as well as a comparison with similar homes in the area
Home Values in the Area
Average Home Value in this Area
Purchase History
| Date | Buyer | Sale Price | Title Company |
|---|---|---|---|
| Struthers Kevin L | $4,500,000 | Nta | |
| Struthers Kevin L | -- | -- | |
| Struthers Kevin L | $45,000 | -- |
Source: Public Records
Mortgage History
| Date | Status | Borrower | Loan Amount |
|---|---|---|---|
| Open | Struthers Kevin L | $80,000 |
Source: Public Records
Tax History Compared to Growth
Tax History
| Year | Tax Paid | Tax Assessment Tax Assessment Total Assessment is a certain percentage of the fair market value that is determined by local assessors to be the total taxable value of land and additions on the property. | Land | Improvement |
|---|---|---|---|---|
| 2025 | $1,533 | $46,850 | $0 | $0 |
| 2024 | $1,262 | $41,300 | $0 | $0 |
| 2023 | $1,201 | $36,300 | $0 | $0 |
| 2022 | $1,380 | $33,000 | $0 | $0 |
| 2021 | $1,297 | $31,100 | $31,100 | $0 |
| 2020 | $1,380 | $29,200 | $29,200 | $0 |
| 2019 | $1,350 | $27,850 | $0 | $0 |
| 2018 | $1,336 | $27,200 | $0 | $0 |
| 2017 | $1,310 | $26,700 | $0 | $0 |
| 2016 | $1,356 | $27,800 | $0 | $27,800 |
| 2015 | $1,318 | $28,250 | $0 | $28,250 |
| 2014 | $1,318 | $27,650 | $0 | $27,650 |
Source: Public Records
Map
Nearby Homes