Estimated Value: $1,324,000 - $1,455,946
5
Beds
3
Baths
2,867
Sq Ft
$480/Sq Ft
Est. Value
About This Home
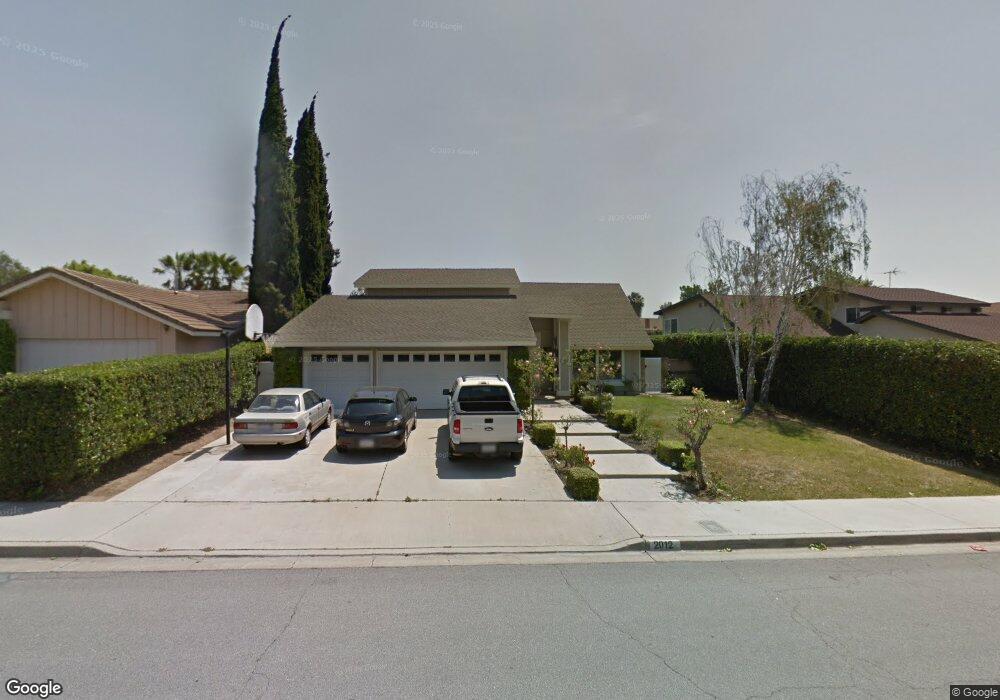
This home is located at 2012 E Eucalyptus Ln, Brea, CA 92821 and is currently estimated at $1,376,737, approximately $480 per square foot. 2012 E Eucalyptus Ln is a home located in Orange County with nearby schools including Brea Country Hills Elementary School, Brea Junior High School, and Brea-Olinda High School.
Ownership History
Date
Name
Owned For
Owner Type
Purchase Details
Closed on
Feb 27, 2026
Sold by
Vincent Frick and Leanne King Cynthia
Bought by
Fricking Family Trust and Frick
Current Estimated Value
Purchase Details
Closed on
Aug 21, 2013
Sold by
Frick Lawrence V and King Cynthia L
Bought by
Frick Lawrence and King Cynthia L
Home Financials for this Owner
Home Financials are based on the most recent Mortgage that was taken out on this home.
Original Mortgage
$574,500
Interest Rate
4.33%
Mortgage Type
New Conventional
Purchase Details
Closed on
May 3, 2006
Sold by
Ganser Scott E and Ganser Denise L
Bought by
Frick Lawrence and King Cynthia L
Home Financials for this Owner
Home Financials are based on the most recent Mortgage that was taken out on this home.
Original Mortgage
$636,000
Interest Rate
6.52%
Mortgage Type
Fannie Mae Freddie Mac
Purchase Details
Closed on
Jan 11, 1996
Sold by
Ganser Scott E and Ganser Denise L
Bought by
Ganser Scott E and Ganser Denise L
Create a Home Valuation Report for This Property
The Home Valuation Report is an in-depth analysis detailing your home's value as well as a comparison with similar homes in the area
Home Values in the Area
Average Home Value in this Area
Purchase History
| Date | Buyer | Sale Price | Title Company |
|---|---|---|---|
| Fricking Family Trust | -- | None Listed On Document | |
| Frick Lawrence | -- | Lsi | |
| Frick Lawrence | $795,000 | Southland Title Corporation | |
| Ganser Scott E | -- | -- |
Source: Public Records
Mortgage History
| Date | Status | Borrower | Loan Amount |
|---|---|---|---|
| Previous Owner | Frick Lawrence | $574,500 | |
| Previous Owner | Frick Lawrence | $636,000 |
Source: Public Records
Tax History
| Year | Tax Paid | Tax Assessment Tax Assessment Total Assessment is a certain percentage of the fair market value that is determined by local assessors to be the total taxable value of land and additions on the property. | Land | Improvement |
|---|---|---|---|---|
| 2025 | $12,066 | $1,086,428 | $827,482 | $258,946 |
| 2024 | $12,066 | $1,065,126 | $811,257 | $253,869 |
| 2023 | $10,981 | $974,854 | $769,743 | $205,111 |
| 2022 | $10,884 | $955,740 | $754,650 | $201,090 |
| 2021 | $10,679 | $937,000 | $739,852 | $197,148 |
| 2020 | $10,055 | $877,200 | $680,052 | $197,148 |
| 2019 | $9,780 | $860,000 | $666,717 | $193,283 |
| 2018 | $9,059 | $791,000 | $597,717 | $193,283 |
| 2017 | $9,059 | $791,000 | $597,717 | $193,283 |
| 2016 | $8,279 | $720,980 | $527,697 | $193,283 |
| 2015 | $8,284 | $720,980 | $527,697 | $193,283 |
| 2014 | $8,198 | $720,980 | $527,697 | $193,283 |
Source: Public Records
Map
Nearby Homes
- 136 Donnybrook Rd
- 2304 Carrotwood Dr
- 2418 Rainbow Ln
- 1796 Ravencrest Dr
- 2583 Sandpebble Ln
- 2849 Tarragon Ct
- 570 Olive Ave
- 520 N Bardsdale Place
- 2851 Rolling Hills Dr Unit 178
- 2851 Rolling Hills Dr Unit 257
- 2851 Rolling Hills Dr Unit 248
- 2851 Rolling Hills Dr
- 2826 Lemonwood Ct
- 2761 E Stearns St
- 688 Buttonwood Dr
- 213 Appalachian Cir
- 206 Allegheny Cir
- 3054 Associated Rd Unit 20
- 2976 E Coalinga Dr
- 3000 Associated Rd Unit 60
- 1996 E Eucalyptus Ln
- 2028 E Eucalyptus Ln
- 1980 E Eucalyptus Ln
- 2044 E Eucalyptus Ln
- 1964 E Eucalyptus Ln
- 2060 E Eucalyptus Ln
- 2081 Chevy Chase Dr
- 2061 Chevy Chase Dr
- 2111 Chevy Chase Dr
- 2045 Chevy Chase Dr
- 242 Amberwick Cir
- 1948 E Eucalyptus Ln
- 2086 E Eucalyptus Ln
- 2033 Chevy Chase Dr
- 2113 Chevy Chase Dr
- 222 Amberwick Cir
- 1932 E Eucalyptus Ln
- 2085 E Eucalyptus Ln
- 2112 E Eucalyptus Ln
- 2003 Chevy Chase Dr
Your Personal Tour Guide
Ask me questions while you tour the home.