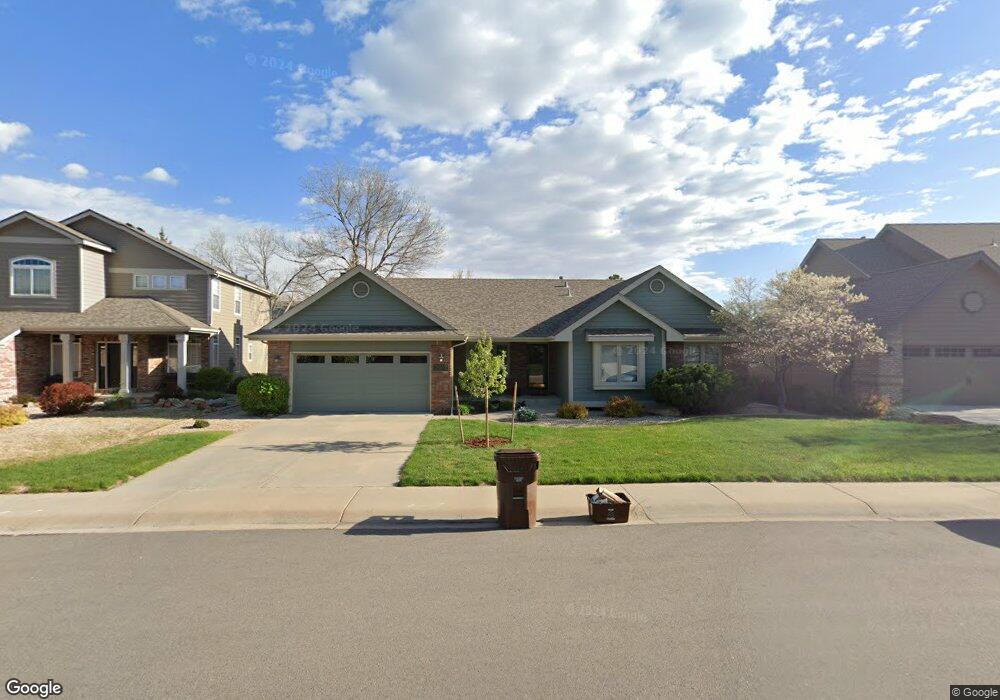
2012 Mackenzie Ct Fort Collins, CO 80528
Estimated Value: $634,562 - $749,000
3
Beds
3
Baths
1,850
Sq Ft
$379/Sq Ft
Est. Value
About This Home
This home is located at 2012 Mackenzie Ct, Fort Collins, CO 80528 and is currently estimated at $700,891, approximately $378 per square foot. 2012 Mackenzie Ct is a home located in Larimer County with nearby schools including Kruse Elementary School, Boltz Middle School, and Fort Collins High School.
Ownership History
Date
Name
Owned For
Owner Type
Purchase Details
Closed on
Aug 16, 2002
Sold by
Eiman W K
Bought by
Miller Martine S and Miller Gary R
Current Estimated Value
Home Financials for this Owner
Home Financials are based on the most recent Mortgage that was taken out on this home.
Original Mortgage
$140,000
Interest Rate
6.48%
Purchase Details
Closed on
Jul 18, 2002
Sold by
Eiman W K
Bought by
William K Eiman Living Trust
Home Financials for this Owner
Home Financials are based on the most recent Mortgage that was taken out on this home.
Original Mortgage
$140,000
Interest Rate
6.48%
Purchase Details
Closed on
Dec 7, 1999
Sold by
Eiman William K
Bought by
Eiman W K and William K Eiman Living Trust
Purchase Details
Closed on
May 15, 1997
Sold by
Paragon Point Partners Ltd Partnership
Bought by
Kem Homes Inc
Home Financials for this Owner
Home Financials are based on the most recent Mortgage that was taken out on this home.
Original Mortgage
$162,400
Interest Rate
8.16%
Mortgage Type
Construction
Create a Home Valuation Report for This Property
The Home Valuation Report is an in-depth analysis detailing your home's value as well as a comparison with similar homes in the area
Home Values in the Area
Average Home Value in this Area
Purchase History
| Date | Buyer | Sale Price | Title Company |
|---|---|---|---|
| Miller Martine S | $274,900 | Land Title Guarantee Company | |
| William K Eiman Living Trust | -- | -- | |
| Eiman W K | -- | -- | |
| Kem Homes Inc | $40,800 | -- |
Source: Public Records
Mortgage History
| Date | Status | Borrower | Loan Amount |
|---|---|---|---|
| Closed | Miller Martine S | $140,000 | |
| Previous Owner | Kem Homes Inc | $162,400 |
Source: Public Records
Tax History Compared to Growth
Tax History
| Year | Tax Paid | Tax Assessment Tax Assessment Total Assessment is a certain percentage of the fair market value that is determined by local assessors to be the total taxable value of land and additions on the property. | Land | Improvement |
|---|---|---|---|---|
| 2025 | $3,233 | $44,079 | $5,695 | $38,384 |
| 2024 | $3,076 | $44,079 | $5,695 | $38,384 |
| 2022 | $2,364 | $31,984 | $5,908 | $26,076 |
| 2021 | $2,389 | $32,905 | $6,078 | $26,827 |
| 2020 | $2,129 | $29,909 | $6,078 | $23,831 |
| 2019 | $2,139 | $29,909 | $6,078 | $23,831 |
| 2018 | $1,910 | $28,152 | $6,120 | $22,032 |
| 2017 | $1,903 | $28,152 | $6,120 | $22,032 |
| 2016 | $1,815 | $27,844 | $6,766 | $21,078 |
| 2015 | $1,802 | $27,850 | $6,770 | $21,080 |
| 2014 | $1,589 | $25,390 | $6,770 | $18,620 |
Source: Public Records
Map
Nearby Homes
- 5502 Weeping Way
- 5225 White Willow Dr Unit J110
- 5225 White Willow Dr Unit F200
- 5225 White Willow Dr Unit Q120
- 5225 White Willow Dr Unit N210
- 5225 White Willow Dr Unit N120
- 2107 Stillwater Creek Dr
- 1715 Globe Ct
- 5121 Stillwater Creek Dr Unit B
- 2142 Stetson Creek Dr
- 1638 Happy Woodland Dr
- 1702 Floating Leaf Dr
- 1632 Happy Woodland Dr
- 2138 Copper Creek Dr Unit B
- 1708 Floating Leaf Dr
- 1626 Happy Woodland Dr
- 5609 Coppervein St
- 1714 Floating Leaf Dr
- 1732 Floating Leaf Dr
- 1726 Floating Leaf Dr
- 2018 Mackenzie Ct
- 2013 Topanga Ct
- 2000 Mackenzie Ct
- 2007 Topanga Ct
- 2007 Mackenzie Ct
- 2019 Topanga Ct
- 2013 Mackenzie Ct
- 2001 Mackenzie Ct
- 2001 Topanga Ct
- 1918 Mackenzie Ct
- 5318 White Willow Dr
- 1919 Mackenzie Ct
- 5400 White Willow Dr
- 5312 White Willow Dr
- 1907 Topanga Ct
- 5406 White Willow Dr
- 5306 White Willow Dr
- 1912 Mackenzie Ct
- 1913 Mackenzie Ct
- 5412 White Willow Dr