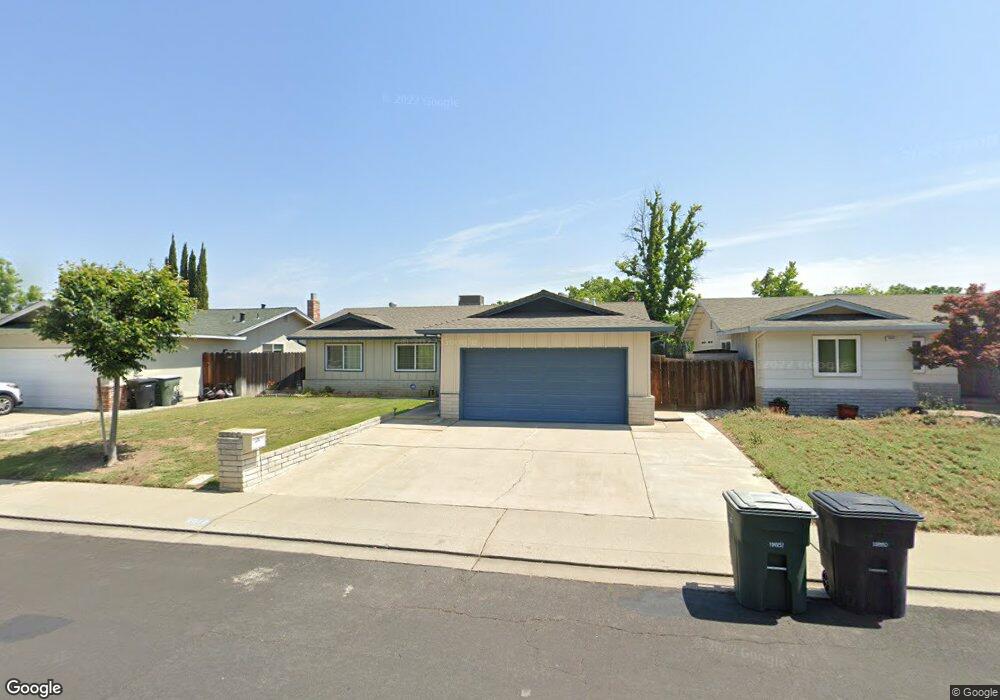
2012 Monte Carlo Ct Modesto, CA 95350
Central Modesto NeighborhoodEstimated Value: $329,000 - $437,366
3
Beds
2
Baths
1,325
Sq Ft
$309/Sq Ft
Est. Value
About This Home
This home is located at 2012 Monte Carlo Ct, Modesto, CA 95350 and is currently estimated at $409,342, approximately $308 per square foot. 2012 Monte Carlo Ct is a home located in Stanislaus County with nearby schools including Elihu Beard Elementary School, Roosevelt Junior High School, and Grace M. Davis High School.
Ownership History
Date
Name
Owned For
Owner Type
Purchase Details
Closed on
Mar 23, 2009
Sold by
Sereno Debora I
Bought by
Sereno Debora I and Debora Sereno Trust
Current Estimated Value
Purchase Details
Closed on
Dec 24, 2001
Sold by
Pacheco Michael and Pacheco Patricia A
Bought by
Sereno Debora I
Home Financials for this Owner
Home Financials are based on the most recent Mortgage that was taken out on this home.
Original Mortgage
$124,900
Outstanding Balance
$48,588
Interest Rate
6.51%
Estimated Equity
$360,754
Purchase Details
Closed on
Jul 16, 1998
Sold by
Baker J L and Baker Elizabeth
Bought by
Andersen Patricia A and Borba Edward
Home Financials for this Owner
Home Financials are based on the most recent Mortgage that was taken out on this home.
Original Mortgage
$107,644
Interest Rate
6.9%
Mortgage Type
FHA
Create a Home Valuation Report for This Property
The Home Valuation Report is an in-depth analysis detailing your home's value as well as a comparison with similar homes in the area
Home Values in the Area
Average Home Value in this Area
Purchase History
| Date | Buyer | Sale Price | Title Company |
|---|---|---|---|
| Sereno Debora I | -- | None Available | |
| Sereno Debora I | $160,000 | Fidelity National Title Co | |
| Pacheco Michael | -- | Fidelity National Title Co | |
| Andersen Patricia A | $108,500 | Chicago Title Co |
Source: Public Records
Mortgage History
| Date | Status | Borrower | Loan Amount |
|---|---|---|---|
| Open | Sereno Debora I | $124,900 | |
| Previous Owner | Andersen Patricia A | $107,644 |
Source: Public Records
Tax History
| Year | Tax Paid | Tax Assessment Tax Assessment Total Assessment is a certain percentage of the fair market value that is determined by local assessors to be the total taxable value of land and additions on the property. | Land | Improvement |
|---|---|---|---|---|
| 2025 | $2,682 | $236,345 | $59,080 | $177,265 |
| 2024 | $2,560 | $231,712 | $57,922 | $173,790 |
| 2023 | $2,521 | $227,170 | $56,787 | $170,383 |
| 2022 | $2,458 | $222,717 | $55,674 | $167,043 |
| 2021 | $2,311 | $218,351 | $54,583 | $163,768 |
| 2020 | $2,355 | $216,113 | $54,024 | $162,089 |
| 2019 | $2,299 | $211,876 | $52,965 | $158,911 |
| 2018 | $2,188 | $207,723 | $51,927 | $155,796 |
| 2017 | $2,134 | $203,651 | $50,909 | $152,742 |
| 2016 | $2,091 | $199,659 | $49,911 | $149,748 |
| 2015 | $2,006 | $191,500 | $36,500 | $155,000 |
| 2014 | $1,933 | $184,000 | $35,000 | $149,000 |
Source: Public Records
Map
Nearby Homes
- 816 Bowen Ave
- 2205 Tully Rd
- 820 Hawthorne Ave
- 1306 Joni Ave
- 1615 College Ave
- 617 W Granger Ave Unit 66
- 617 W Granger Ave Unit 17
- 617 W Granger Ave Unit 1
- 617 W Granger Ave Unit 14
- 617 W Granger Ave Unit 82
- 1405 Theo Ave
- 2013 Sherwood Ave
- 1921 Sherwood Ave
- 1618 Linwood Dr
- 1534 Bay Meadows Dr
- 1436 Albany Ave
- 1314 Glenwood Dr
- 309 Northwood Dr
- 1603 Silkwood Dr
- 1605 Pimlico Dr
- 2016 Monte Carlo Ct
- 2008 Monte Carlo Ct
- 2013 College Ave
- 2004 Monte Carlo Ct
- 2020 Monte Carlo Ct
- 2009 College Ave
- 2017 College Ave
- 2013 Monte Carlo Ct
- 2005 College Ave
- 2009 Monte Carlo Ct
- 2017 Monte Carlo Ct
- 2021 College Ave
- 1105 Monte Cristo Ave
- 2005 Monte Carlo Ct
- 2024 Monte Carlo Ct
- 2021 Monte Carlo Ct
- 1101 Monte Cristo Ave
- 2025 College Ave
- 1117 Monte Cristo Ave
- 2028 Monte Carlo Ct
Your Personal Tour Guide
Ask me questions while you tour the home.