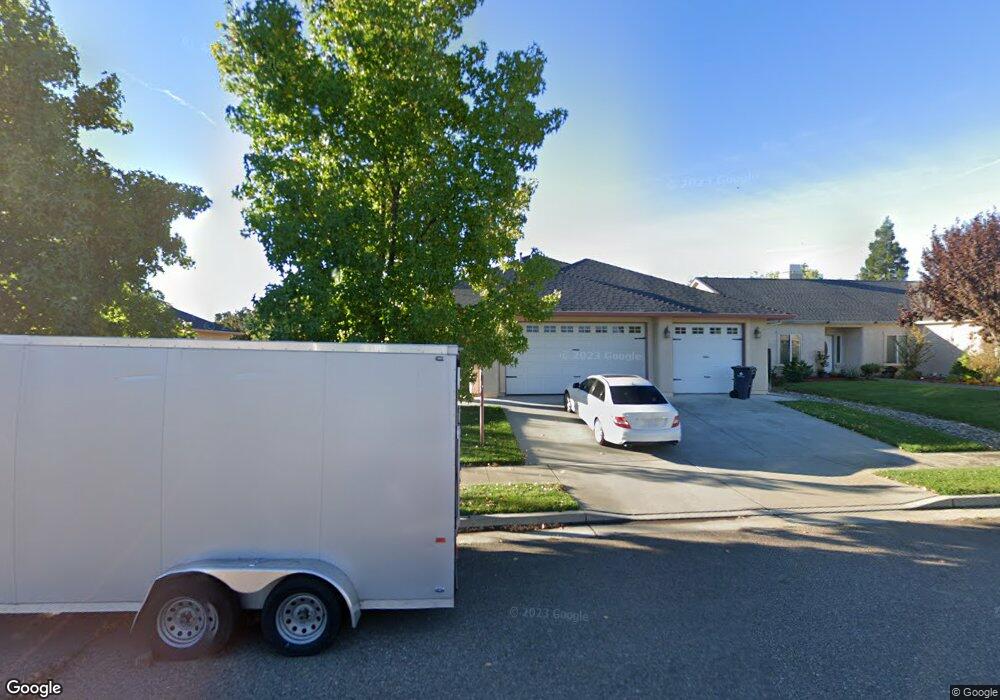
2015 Greystone Ct Red Bluff, CA 96080
Estimated Value: $386,586 - $413,000
3
Beds
2
Baths
1,818
Sq Ft
$217/Sq Ft
Est. Value
About This Home
This home is located at 2015 Greystone Ct, Red Bluff, CA 96080 and is currently estimated at $394,147, approximately $216 per square foot. 2015 Greystone Ct is a home located in Tehama County with nearby schools including Bidwell Elementary School, Vista Preparatory Academy, and Red Bluff High School.
Ownership History
Date
Name
Owned For
Owner Type
Purchase Details
Closed on
Jan 20, 2021
Sold by
Banwarth Norman E and Banwarth Cheryl R
Bought by
Banwarth Norman E and Banwarth Cheryl R
Current Estimated Value
Home Financials for this Owner
Home Financials are based on the most recent Mortgage that was taken out on this home.
Original Mortgage
$150,000
Interest Rate
2.71%
Mortgage Type
New Conventional
Purchase Details
Closed on
Feb 25, 2010
Sold by
Banwarth Norman and Banwarth Cheryl
Bought by
Banwarth Norman E and Banwarth Cheryl R
Purchase Details
Closed on
Dec 2, 2009
Sold by
Banwarth Norman E and Banwarth Cheryl R
Bought by
Banwarth Norman and Banwarth Cheryl
Home Financials for this Owner
Home Financials are based on the most recent Mortgage that was taken out on this home.
Original Mortgage
$180,000
Interest Rate
4.99%
Mortgage Type
New Conventional
Purchase Details
Closed on
Sep 8, 2006
Sold by
Banwarth Norman E and Banwarth Cheryl R
Bought by
Banwarth Norman E and Banwarth Cheryl R
Create a Home Valuation Report for This Property
The Home Valuation Report is an in-depth analysis detailing your home's value as well as a comparison with similar homes in the area
Purchase History
| Date | Buyer | Sale Price | Title Company |
|---|---|---|---|
| Banwarth Norman E | -- | Fidelity Natl Ttl Co Of Ca | |
| Banwarth Norman E | -- | Placer Title Company | |
| Banwarth Norman | -- | Placer Title Company | |
| Banwarth Norman E | -- | None Available |
Source: Public Records
Mortgage History
| Date | Status | Borrower | Loan Amount |
|---|---|---|---|
| Closed | Banwarth Norman E | $150,000 | |
| Closed | Banwarth Norman | $180,000 |
Source: Public Records
Tax History
| Year | Tax Paid | Tax Assessment Tax Assessment Total Assessment is a certain percentage of the fair market value that is determined by local assessors to be the total taxable value of land and additions on the property. | Land | Improvement |
|---|---|---|---|---|
| 2025 | $3,131 | $308,321 | $846 | $307,475 |
| 2023 | $3,079 | $296,351 | $814 | $295,537 |
| 2022 | $3,058 | $290,542 | $799 | $289,743 |
| 2021 | $2,935 | $284,846 | $784 | $284,062 |
| 2020 | $2,996 | $281,926 | $776 | $281,150 |
| 2019 | $3,015 | $276,399 | $761 | $275,638 |
| 2018 | $2,665 | $259,010 | $86,337 | $172,673 |
| 2017 | $2,494 | $235,463 | $78,488 | $156,975 |
| 2016 | $2,263 | $224,250 | $74,750 | $149,500 |
| 2015 | -- | $224,250 | $74,750 | $149,500 |
| 2014 | $1,978 | $195,000 | $65,000 | $130,000 |
Source: Public Records
Map
Nearby Homes
- 2030 Pebblestone Dr
- 550 Bayles Ave
- 675 Larie Ln
- 685 Larie Ln
- 329 Michael Dr
- 1645 Aloha St
- 1402 Scottsdale Way
- 1480 Leonard Ln
- 1455 Acacia St
- 1560 Carl Ct
- 1307 Deborah Dr
- 1270 Aloha St
- 1235 Britt Ln
- 1160 Orange St
- 1835 Douglass St
- 1570 Douglass St
- 1210 Wetter Way
- 1707 Luning St
- 1359 2nd St
- 1356 Park Ave
- 2005 Greystone Ct
- 2025 Greystone Ct
- 2020 Pebblestone Dr
- 2035 Greystone Ct
- 2020 Greystone Ct
- 2040 Pebblestone Dr
- 2030 Greystone Ct
- 2045 Greystone Ct
- 2050 Pebblestone Dr
- 2040 Greystone Ct
- 2020 Acwron Dr
- 2010 Acwron Dr
- 2030 Acwron Dr
- 2040 Acwron Dr
- 2060 Pebblestone Dr
- 2007 Walnut St
- 2050 Greystone Ct
- 2050 Acwron Dr
- 2000 Walnut St
- 2070 Pebblestone Dr
Your Personal Tour Guide
Ask me questions while you tour the home.