2015 Penngrove St Simi Valley, CA 93065
Central Simi Valley NeighborhoodEstimated Value: $853,000 - $920,000
3
Beds
3
Baths
2,071
Sq Ft
$422/Sq Ft
Est. Value
About This Home
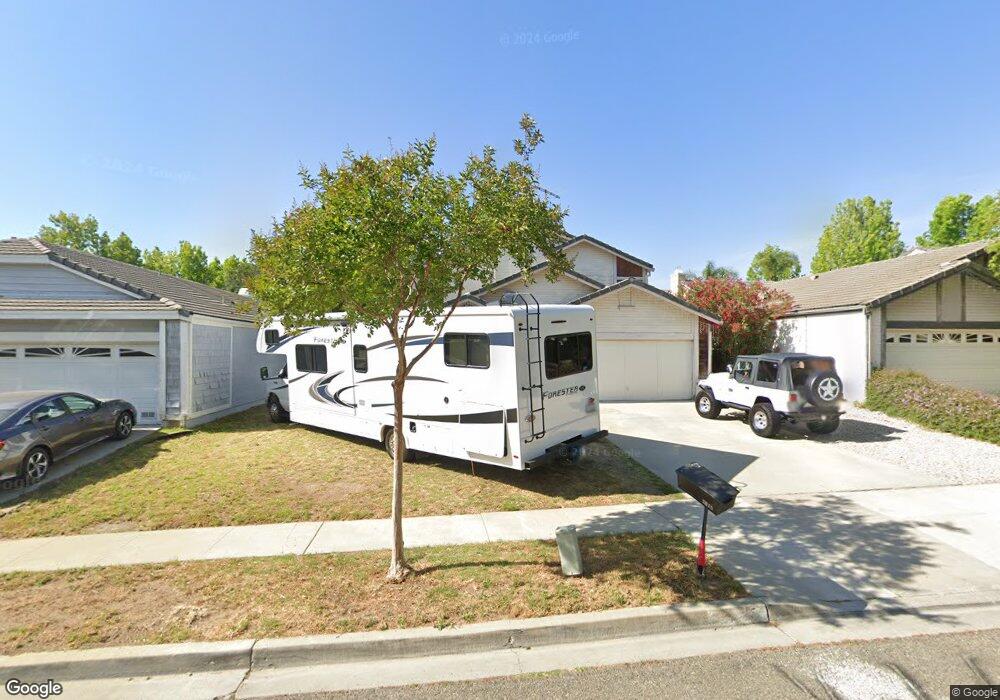
This home is located at 2015 Penngrove St, Simi Valley, CA 93065 and is currently estimated at $874,799, approximately $422 per square foot. 2015 Penngrove St is a home located in Ventura County with nearby schools including Park View Elementary School, Hillside Middle School, and Royal High School.
Ownership History
Date
Name
Owned For
Owner Type
Purchase Details
Closed on
Feb 23, 2019
Sold by
Nguyen Dieuly
Bought by
Nguyen Dieuly and The Db Living Trust
Current Estimated Value
Purchase Details
Closed on
May 8, 2018
Sold by
Vanvanbach Pat Van and Nguyen Poenly Mi
Bought by
Vanvanbach Dat Van and Nguyen Poenly Mi
Create a Home Valuation Report for This Property
The Home Valuation Report is an in-depth analysis detailing your home's value as well as a comparison with similar homes in the area
Home Values in the Area
Average Home Value in this Area
Purchase History
| Date | Buyer | Sale Price | Title Company |
|---|---|---|---|
| Nguyen Dieuly | -- | None Available | |
| Vanvanbach Dat Van | -- | None Available |
Source: Public Records
Tax History Compared to Growth
Tax History
| Year | Tax Paid | Tax Assessment Tax Assessment Total Assessment is a certain percentage of the fair market value that is determined by local assessors to be the total taxable value of land and additions on the property. | Land | Improvement |
|---|---|---|---|---|
| 2025 | $4,887 | $371,220 | $129,921 | $241,299 |
| 2024 | $4,887 | $363,942 | $127,374 | $236,568 |
| 2023 | $4,600 | $356,806 | $124,876 | $231,930 |
| 2022 | $4,572 | $349,810 | $122,427 | $227,383 |
| 2021 | $4,530 | $342,951 | $120,026 | $222,925 |
| 2020 | $4,432 | $339,437 | $118,797 | $220,640 |
| 2019 | $4,234 | $332,782 | $116,468 | $216,314 |
| 2018 | $4,193 | $326,258 | $114,185 | $212,073 |
| 2017 | $4,098 | $319,862 | $111,947 | $207,915 |
| 2016 | $3,917 | $313,591 | $109,752 | $203,839 |
| 2015 | $3,832 | $308,882 | $108,104 | $200,778 |
| 2014 | $3,774 | $302,834 | $105,988 | $196,846 |
Source: Public Records
Map
Nearby Homes
- 2650 Belburn Place
- 2410 N Justin Ave
- 1807 Stoneman St
- 2239 McDonald St
- 2357 Lawnview Ct
- 2731 Erringer Rd Unit 21
- 2355 E Alden St
- 2091 Marter Ave
- 2266 Lansdale Ct
- 2163 N Justin Ave
- 1886 Cloud Ct
- 2148 Stoneman St
- 2063 Woodglen St
- 2505 Winthrop Ct
- 2241 Burnside St
- 1620 Spence St
- 1663 Anderson St
- 2234 Callahan Ave
- 2306 Madrone St
- 2005 Penngrove St
- 2522 Almaden Ct
- 2035 Penngrove St
- 2521 Belvedere Ct
- 2528 Almaden Ct
- 2527 Belvedere Ct
- 1985 Penngrove St
- 2534 Almaden Ct
- 2020 Penngrove St
- 2012 Penngrove St
- 2533 Belvedere Ct
- 2032 Penngrove St
- 2004 Penngrove St
- 2521 Almaden Ct
- 2040 Penngrove St
- 1996 Penngrove St
- 2540 Almaden Ct
- 2065 Penngrove St
- 1975 Penngrove St
- 2527 Almaden Ct