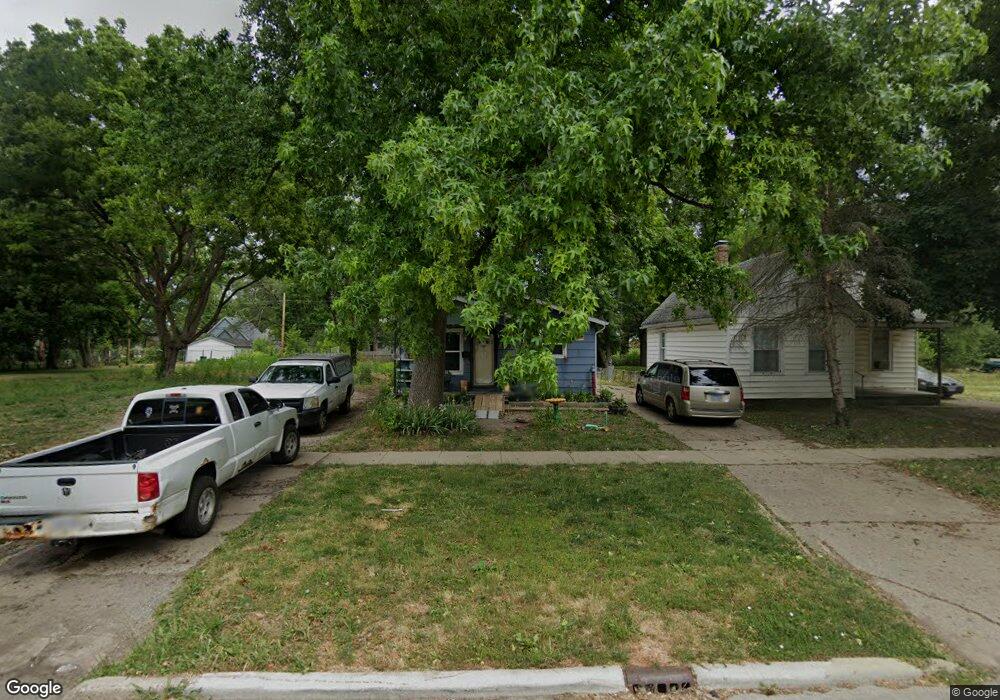
2017 E Jackson St Springfield, IL 62703
Estimated Value: $52,000 - $60,730
3
Beds
1
Bath
960
Sq Ft
$60/Sq Ft
Est. Value
About This Home
This home is located at 2017 E Jackson St, Springfield, IL 62703 and is currently estimated at $57,683, approximately $60 per square foot. 2017 E Jackson St is a home located in Sangamon County with nearby schools including Fairview Elementary School, Washington Middle School, and Lanphier High School.
Ownership History
Date
Name
Owned For
Owner Type
Purchase Details
Closed on
Feb 6, 2024
Sold by
Wykoff Mortgage Services Inc
Bought by
Drn Rentals Llc
Current Estimated Value
Home Financials for this Owner
Home Financials are based on the most recent Mortgage that was taken out on this home.
Original Mortgage
$20,000
Outstanding Balance
$17,248
Interest Rate
6.62%
Mortgage Type
New Conventional
Estimated Equity
$40,435
Purchase Details
Closed on
Feb 1, 2024
Sold by
Wykoff Mortgage Services Inc and Wykoff Professional Svc Inc
Bought by
Drn Rentals Llc
Home Financials for this Owner
Home Financials are based on the most recent Mortgage that was taken out on this home.
Original Mortgage
$20,000
Outstanding Balance
$17,248
Interest Rate
6.62%
Mortgage Type
New Conventional
Estimated Equity
$40,435
Purchase Details
Closed on
Jul 2, 2010
Purchase Details
Closed on
Nov 20, 2009
Purchase Details
Closed on
Mar 20, 2009
Purchase Details
Closed on
May 28, 2004
Purchase Details
Closed on
Jul 23, 1999
Purchase Details
Closed on
Jun 26, 1999
Purchase Details
Closed on
Jun 24, 1999
Purchase Details
Closed on
Jan 2, 1999
Purchase Details
Closed on
Dec 18, 1998
Create a Home Valuation Report for This Property
The Home Valuation Report is an in-depth analysis detailing your home's value as well as a comparison with similar homes in the area
Purchase History
| Date | Buyer | Sale Price | Title Company |
|---|---|---|---|
| Drn Rentals Llc | $25,000 | None Listed On Document | |
| Drn Rentals Llc | $25,000 | None Listed On Document | |
| -- | $17,000 | -- | |
| -- | $41,600 | -- | |
| -- | -- | -- | |
| -- | $36,000 | -- | |
| -- | $35,000 | -- | |
| -- | -- | -- | |
| -- | -- | -- | |
| -- | -- | -- | |
| -- | -- | -- |
Source: Public Records
Mortgage History
| Date | Status | Borrower | Loan Amount |
|---|---|---|---|
| Open | Drn Rentals Llc | $20,000 | |
| Closed | Drn Rentals Llc | $20,000 |
Source: Public Records
Tax History
| Year | Tax Paid | Tax Assessment Tax Assessment Total Assessment is a certain percentage of the fair market value that is determined by local assessors to be the total taxable value of land and additions on the property. | Land | Improvement |
|---|---|---|---|---|
| 2024 | $926 | $11,029 | $1,559 | $9,470 |
| 2023 | $1,174 | $13,280 | $1,424 | $11,856 |
| 2022 | $1,129 | $12,597 | $1,351 | $11,246 |
| 2021 | $1,091 | $12,125 | $1,300 | $10,825 |
| 2020 | $1,070 | $12,143 | $1,302 | $10,841 |
| 2019 | $1,050 | $12,100 | $1,297 | $10,803 |
| 2018 | $1,137 | $13,451 | $1,291 | $12,160 |
| 2017 | $1,113 | $13,277 | $1,274 | $12,003 |
| 2016 | $1,091 | $13,083 | $1,255 | $11,828 |
| 2015 | $1,081 | $12,927 | $1,240 | $11,687 |
| 2014 | $1,064 | $12,844 | $1,232 | $11,612 |
| 2013 | $1,041 | $12,844 | $1,232 | $11,612 |
Source: Public Records
Map
Nearby Homes
- 2128 E Capitol Ave
- 2236 E Adams St
- 1529 E Edwards St
- 222 S David St
- 1405 E Edwards St
- 2238 E Stuart St
- 1415 E Jefferson St
- 1105 Knoll Pointe Place
- 1909 E Cedar St
- 2325 E Spruce St
- 1617 E Matheny Ave
- 1838 S 19th St
- 1521 E Matheny Ave
- 718 S 7th St Unit 1003
- 718 S 7th St Unit 405
- 1848 Honeysuckle Ct
- 1123 E Miller St
- 516 N Milton Ave Unit 1
- 905 N Wesley St Unit 1
- 8 S Old State Capitol Plaza Unit A
- 2015 E Jackson St
- 2019 E Jackson St
- 2013 E Jackson St
- 2011 E Jackson St
- 2023 E Jackson St
- 2009 E Jackson St
- 2018 E Jackson St
- 2020 E Jackson St
- 2016 E Jackson St
- 2022 E Jackson St
- 2014 E Jackson St
- 2007 E Jackson St
- 2024 E Jackson St
- 2012 E Jackson St
- 2027 E Jackson St
- 2026 E Capitol Ave
- 2022 E Capitol Ave
- 2010 E Jackson St
- 2028 E Capitol Ave
- 2006 E Jackson St
Your Personal Tour Guide
Ask me questions while you tour the home.