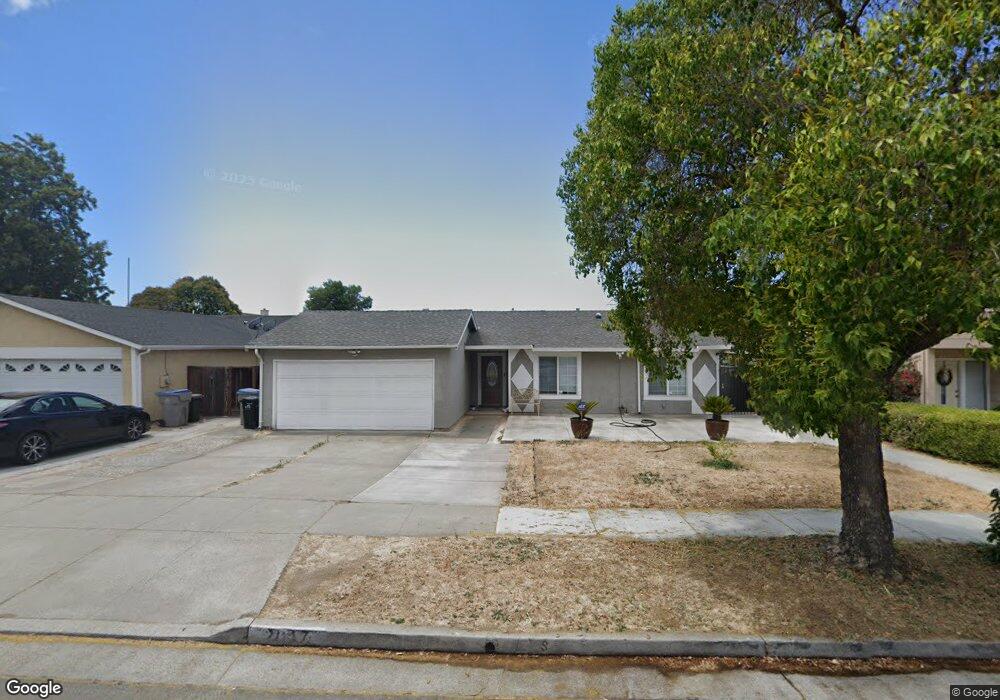
2017 Ridgemont Dr San Jose, CA 95148
Ocala-Sundown NeighborhoodEstimated Value: $925,000 - $1,246,000
3
Beds
2
Baths
1,506
Sq Ft
$742/Sq Ft
Est. Value
About This Home
This home is located at 2017 Ridgemont Dr, San Jose, CA 95148 and is currently estimated at $1,117,874, approximately $742 per square foot. 2017 Ridgemont Dr is a home located in Santa Clara County with nearby schools including Thomas P. Ryan Elementary School, Ocala Middle School, and Mt. Pleasant High School.
Ownership History
Date
Name
Owned For
Owner Type
Purchase Details
Closed on
Apr 12, 2011
Sold by
Truong My Linh Thi
Bought by
Truong My Linh Thi and Le Hoang Mong
Current Estimated Value
Purchase Details
Closed on
Oct 14, 2010
Sold by
Medina Carlos and Medina Maria M
Bought by
Truong My Linh Thi
Home Financials for this Owner
Home Financials are based on the most recent Mortgage that was taken out on this home.
Original Mortgage
$296,250
Interest Rate
4.31%
Mortgage Type
New Conventional
Purchase Details
Closed on
Jan 11, 2002
Sold by
Medina Frank and Medina Maria Lourdes
Bought by
Medina Carlos and Medina Maria M
Purchase Details
Closed on
Jul 29, 1998
Sold by
Frank Medina and Frank Maria L
Bought by
Medina Frank and Medina Maria Lourdes
Home Financials for this Owner
Home Financials are based on the most recent Mortgage that was taken out on this home.
Original Mortgage
$145,000
Interest Rate
6.93%
Create a Home Valuation Report for This Property
The Home Valuation Report is an in-depth analysis detailing your home's value as well as a comparison with similar homes in the area
Home Values in the Area
Average Home Value in this Area
Purchase History
| Date | Buyer | Sale Price | Title Company |
|---|---|---|---|
| Truong My Linh Thi | -- | None Available | |
| Truong My Linh Thi | $398,000 | Cornerstone Title Company | |
| Medina Carlos | -- | First American Title Guarant | |
| Medina Frank | $72,500 | Fidelity National Title Ins |
Source: Public Records
Mortgage History
| Date | Status | Borrower | Loan Amount |
|---|---|---|---|
| Previous Owner | Truong My Linh Thi | $296,250 | |
| Previous Owner | Medina Frank | $145,000 |
Source: Public Records
Tax History
| Year | Tax Paid | Tax Assessment Tax Assessment Total Assessment is a certain percentage of the fair market value that is determined by local assessors to be the total taxable value of land and additions on the property. | Land | Improvement |
|---|---|---|---|---|
| 2025 | $7,937 | $491,959 | $325,860 | $166,099 |
| 2024 | $7,937 | $482,314 | $319,471 | $162,843 |
| 2023 | $7,771 | $472,857 | $313,207 | $159,650 |
| 2022 | $7,623 | $463,586 | $307,066 | $156,520 |
| 2021 | $7,355 | $454,497 | $301,046 | $153,451 |
| 2020 | $7,202 | $449,838 | $297,960 | $151,878 |
| 2019 | $7,002 | $441,018 | $292,118 | $148,900 |
| 2018 | $6,907 | $432,372 | $286,391 | $145,981 |
| 2017 | $6,926 | $423,895 | $280,776 | $143,119 |
| 2016 | $6,538 | $415,584 | $275,271 | $140,313 |
| 2015 | $6,531 | $409,343 | $271,137 | $138,206 |
| 2014 | $6,026 | $401,325 | $265,826 | $135,499 |
Source: Public Records
Map
Nearby Homes
- 3165 Coldwater Dr
- 1776 Home Gate Dr
- 2030 Flintbury Ct
- 2736 Twin Oaks Ln
- 1572 Amesbury Way
- 3282 Mount Everest Dr
- 2571 Gumdrop Dr
- 1729 Adrian Way
- 3381 Mount Everest Dr
- 1872 Quimby Rd Unit 1872
- 3485 Rubion Ct
- 3455 Cuesta Dr
- 10230 Griffith St
- 2808 Quest Ct
- 1542 Harvest Dr
- 2667 Sand Point Dr
- 10121 Torrance Ave
- 2275 Astrahan Ln
- 1310 Park Pleasant Cir
- 1159 Lancelot Ln
- 2027 Ridgemont Dr
- 2009 Ridgemont Dr
- 2035 Ridgemont Dr
- 1999 Ridgemont Dr
- 2010 Ridgemont Dr
- 2018 Ridgemont Dr
- 2045 Ridgemont Dr
- 2028 Ridgemont Dr
- 1991 Ridgemont Dr
- 2002 Ridgemont Dr
- 2183 Cunningham Ct
- 2179 Cunningham Ct
- 2036 Ridgemont Dr
- 2187 Cunningham Ct
- 2959 Cunningham Ave
- 1981 Ridgemont Dr
- 3010 Moonstar Ct
- 2180 Cunningham Ct
- 2046 Ridgemont Dr
- 2037 Cove Ct
Your Personal Tour Guide
Ask me questions while you tour the home.