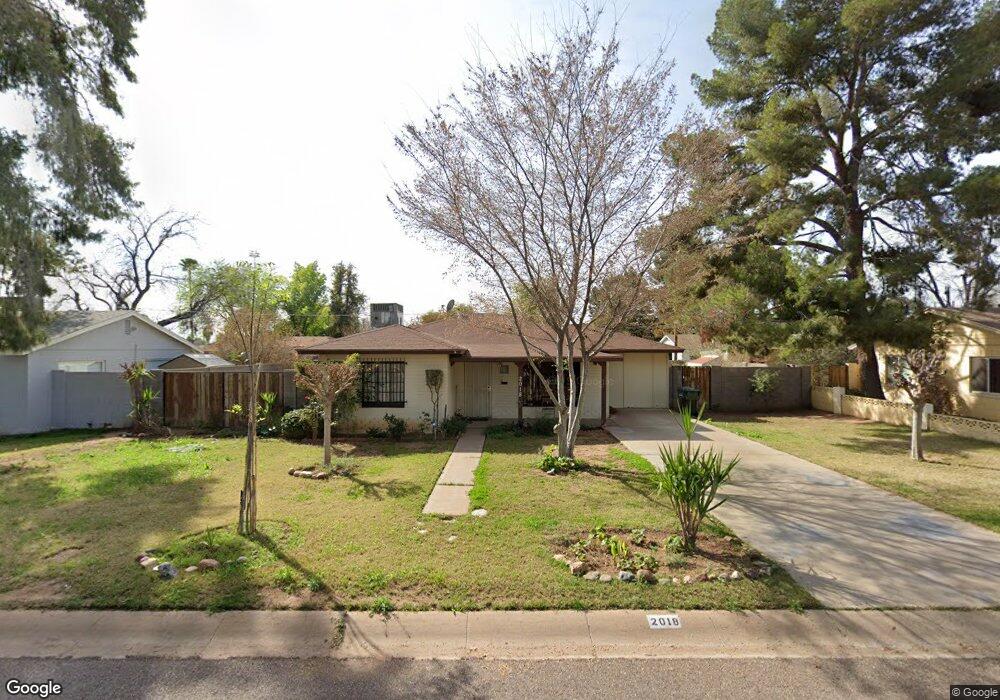
2018 N 38th Way Phoenix, AZ 85008
Camelback East Village NeighborhoodEstimated Value: $380,900 - $534,000
3
Beds
1
Bath
1,219
Sq Ft
$368/Sq Ft
Est. Value
About This Home
This home is located at 2018 N 38th Way, Phoenix, AZ 85008 and is currently estimated at $448,975, approximately $368 per square foot. 2018 N 38th Way is a home located in Maricopa County with nearby schools including Papago School, Camelback High School, and Phoenix Coding Academy.
Ownership History
Date
Name
Owned For
Owner Type
Purchase Details
Closed on
Nov 17, 2020
Sold by
Mata Raul
Bought by
Mata Raul Rivas and Mata Living Trust
Current Estimated Value
Purchase Details
Closed on
Aug 29, 2017
Sold by
Mata Raul R
Bought by
Mata Raul Rivas and Mata Living Trust
Purchase Details
Closed on
Oct 3, 2000
Sold by
1St United Charitable Trust
Bought by
Mioni Carmen A
Home Financials for this Owner
Home Financials are based on the most recent Mortgage that was taken out on this home.
Original Mortgage
$89,264
Interest Rate
7.89%
Mortgage Type
FHA
Purchase Details
Closed on
Jul 6, 2000
Sold by
Hurley Brian M
Bought by
1St United Charitable Trust
Home Financials for this Owner
Home Financials are based on the most recent Mortgage that was taken out on this home.
Original Mortgage
$48,476
Interest Rate
8.12%
Mortgage Type
Purchase Money Mortgage
Create a Home Valuation Report for This Property
The Home Valuation Report is an in-depth analysis detailing your home's value as well as a comparison with similar homes in the area
Home Values in the Area
Average Home Value in this Area
Purchase History
| Date | Buyer | Sale Price | Title Company |
|---|---|---|---|
| Mata Raul Rivas | -- | None Available | |
| Mata Raul Rivas | -- | None Available | |
| Mioni Carmen A | $90,000 | Lawyers Title Of Arizona Inc | |
| 1St United Charitable Trust | $48,500 | Lawyers Title Of Arizona Inc |
Source: Public Records
Mortgage History
| Date | Status | Borrower | Loan Amount |
|---|---|---|---|
| Previous Owner | Mioni Carmen A | $89,264 | |
| Previous Owner | 1St United Charitable Trust | $48,476 |
Source: Public Records
Tax History Compared to Growth
Tax History
| Year | Tax Paid | Tax Assessment Tax Assessment Total Assessment is a certain percentage of the fair market value that is determined by local assessors to be the total taxable value of land and additions on the property. | Land | Improvement |
|---|---|---|---|---|
| 2025 | $1,878 | $15,720 | -- | -- |
| 2024 | $1,784 | $14,972 | -- | -- |
| 2023 | $1,784 | $30,350 | $6,070 | $24,280 |
| 2022 | $1,708 | $23,170 | $4,630 | $18,540 |
| 2021 | $1,772 | $21,710 | $4,340 | $17,370 |
| 2020 | $1,726 | $19,420 | $3,880 | $15,540 |
| 2019 | $1,716 | $18,060 | $3,610 | $14,450 |
| 2018 | $1,679 | $15,100 | $3,020 | $12,080 |
| 2017 | $1,610 | $14,000 | $2,800 | $11,200 |
| 2016 | $989 | $11,760 | $2,350 | $9,410 |
| 2015 | $922 | $8,850 | $1,770 | $7,080 |
Source: Public Records
Map
Nearby Homes
- 2231 N 38th Way
- 2301 N 38th St
- 3813 E Vernon Ave
- 4037 E Oak St
- 3743 E Coronado Rd
- 3609 E Palm Ln
- 2434 N 37th Way
- 3823 E Yale St
- 4211 E Palm Ln Unit 219
- 1644 N 43rd St
- 1225 N 36th St Unit 1042
- 3528 E Sheridan St
- 3347 E Palm Ln
- 4034 E Moreland St
- 4108 E Edgemont Ave
- 3417 E Yale St
- 4429 E Hubbell St Unit 45
- 4337 E Wilshire Dr
- 4213 E Edgemont Ave
- 4217 E Edgemont Ave
- 2010 N 38th Way
- 2022 N 38th Way
- 2008 N 38th Way
- 2017 N 38th Place
- 2023 N 38th Place
- 2009 N 38th Place
- 2009 N 38th St
- 2015 N 38th Way
- 2002 N 38th Way
- 2009 N 38th Way
- 2021 N 38th Way
- 2028 N 38th Way
- 2001 N 38th Place
- 2027 N 38th Place
- 2003 N 38th Way
- 2027 N 38th Way
- 2014 N 39th St
- 2034 N 38th Way
- 2022 N 39th St
- 2006 N 39th St