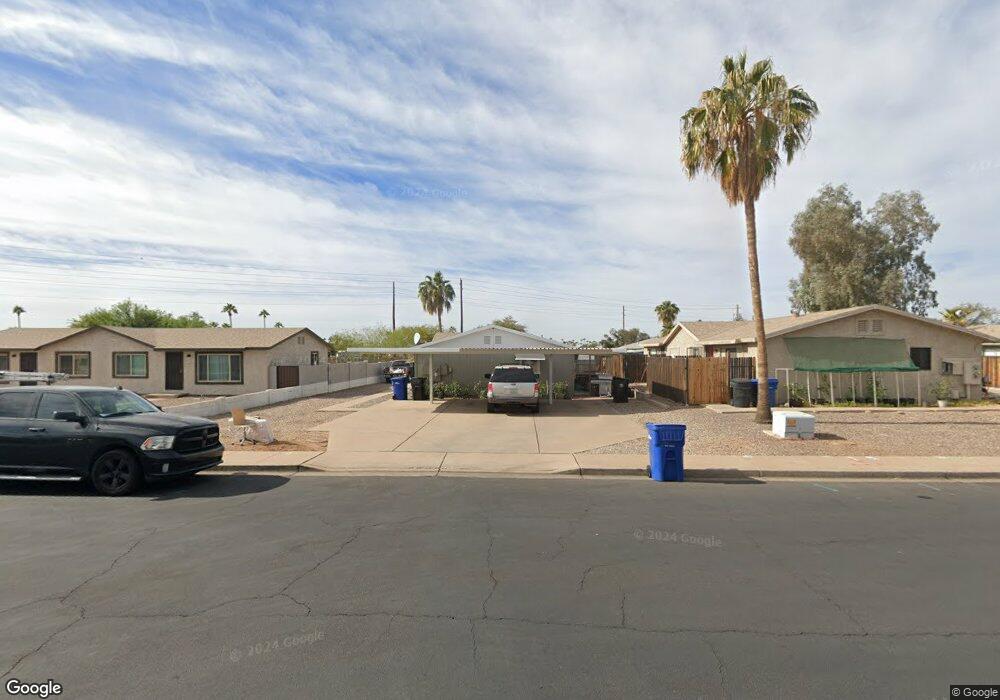
202 S 54th St Mesa, AZ 85206
Central Mesa East NeighborhoodEstimated Value: $331,000 - $429,000
Studio
--
Bath
1,708
Sq Ft
$226/Sq Ft
Est. Value
About This Home
This home is located at 202 S 54th St, Mesa, AZ 85206 and is currently estimated at $386,676, approximately $226 per square foot. 202 S 54th St is a home located in Maricopa County with nearby schools including Madison Elementary School, Franklin at Brimhall Elementary School, and Franklin West Elementary School.
Ownership History
Date
Name
Owned For
Owner Type
Purchase Details
Closed on
Jan 30, 2017
Sold by
Brad Young Pllc
Bought by
Columbo Dominick
Current Estimated Value
Home Financials for this Owner
Home Financials are based on the most recent Mortgage that was taken out on this home.
Original Mortgage
$131,250
Outstanding Balance
$108,972
Interest Rate
4.3%
Mortgage Type
New Conventional
Estimated Equity
$277,704
Purchase Details
Closed on
Nov 23, 2016
Sold by
Simpson Charles E
Bought by
Brad Young Pllc
Purchase Details
Closed on
Feb 26, 2007
Sold by
Simpson Charles L
Bought by
Simpson Charles E
Purchase Details
Closed on
May 31, 2000
Sold by
Simpson Charles E
Bought by
Simpson Charles E and Simpson Charles L
Purchase Details
Closed on
Dec 17, 1998
Sold by
Simpson Cecile D
Bought by
Simpson Charles E
Create a Home Valuation Report for This Property
The Home Valuation Report is an in-depth analysis detailing your home's value as well as a comparison with similar homes in the area
Home Values in the Area
Average Home Value in this Area
Purchase History
| Date | Buyer | Sale Price | Title Company |
|---|---|---|---|
| Columbo Dominick | $175,000 | Driggs Title Agency Inc | |
| Brad Young Pllc | $122,000 | North American Title Company | |
| Simpson Charles E | -- | None Available | |
| Simpson Charles E | -- | -- | |
| Simpson Charles E | -- | -- |
Source: Public Records
Mortgage History
| Date | Status | Borrower | Loan Amount |
|---|---|---|---|
| Open | Columbo Dominick | $131,250 |
Source: Public Records
Tax History
| Year | Tax Paid | Tax Assessment Tax Assessment Total Assessment is a certain percentage of the fair market value that is determined by local assessors to be the total taxable value of land and additions on the property. | Land | Improvement |
|---|---|---|---|---|
| 2025 | $873 | $8,842 | -- | -- |
| 2024 | $876 | $8,421 | -- | -- |
| 2023 | $876 | $25,950 | $5,190 | $20,760 |
| 2022 | $858 | $19,210 | $3,840 | $15,370 |
| 2021 | $868 | $16,860 | $3,370 | $13,490 |
| 2020 | $857 | $15,750 | $3,150 | $12,600 |
| 2019 | $801 | $13,050 | $2,610 | $10,440 |
| 2018 | $769 | $12,830 | $2,560 | $10,270 |
| 2017 | $746 | $11,730 | $2,340 | $9,390 |
| 2016 | $732 | $10,010 | $2,000 | $8,010 |
| 2015 | $688 | $8,350 | $1,670 | $6,680 |
Source: Public Records
Map
Nearby Homes
- 5504 E Aspen Ave
- 5512 E Arbor Ave
- 304 S Arvada
- 206 S 56th St
- 5553 E Baywood Ave
- 358 S Alvaro Cir
- 205 S Higley Rd Unit 26
- 205 S Higley Rd Unit 52
- 205 S Higley Rd Unit 269
- 205 S Higley Rd Unit 245
- 205 S Higley Rd Unit 40
- 205 S Higley Rd Unit 39
- 205 S Higley Rd Unit 75
- 205 S Higley Rd Unit 254
- 205 S Higley Rd Unit 16
- 205 S Higley Rd Unit 60
- 205 S Higley Rd Unit 300
- 205 S Higley Rd Unit 293
- 205 S Higley Rd Unit 266
- 205 S Higley Rd Unit 177
- 202 S 54th St Unit B
- 202 S 54th St Unit A
- 168 S 54th St Unit B
- 168 S 54th St
- 210 S 54th St
- 5349 E Arbor Cir
- 5349 E Arbor Cir Unit A
- 160 S 54th St
- 5406 E Arcadia Ave
- 5407 E Arcadia Ave
- 5413 E Arcadia Ave
- 5412 E Arcadia Ave
- 148 S 54th St Unit A
- 148 S 54th St
- 5413 E Arbor Ave
- 5346 E Arbor Cir
- 5419 E Arcadia Ave
- 5420 E Arcadia Ave
- 5348 E Arbor Cir Unit B
- 5348 E Arbor Cir
Your Personal Tour Guide
Ask me questions while you tour the home.