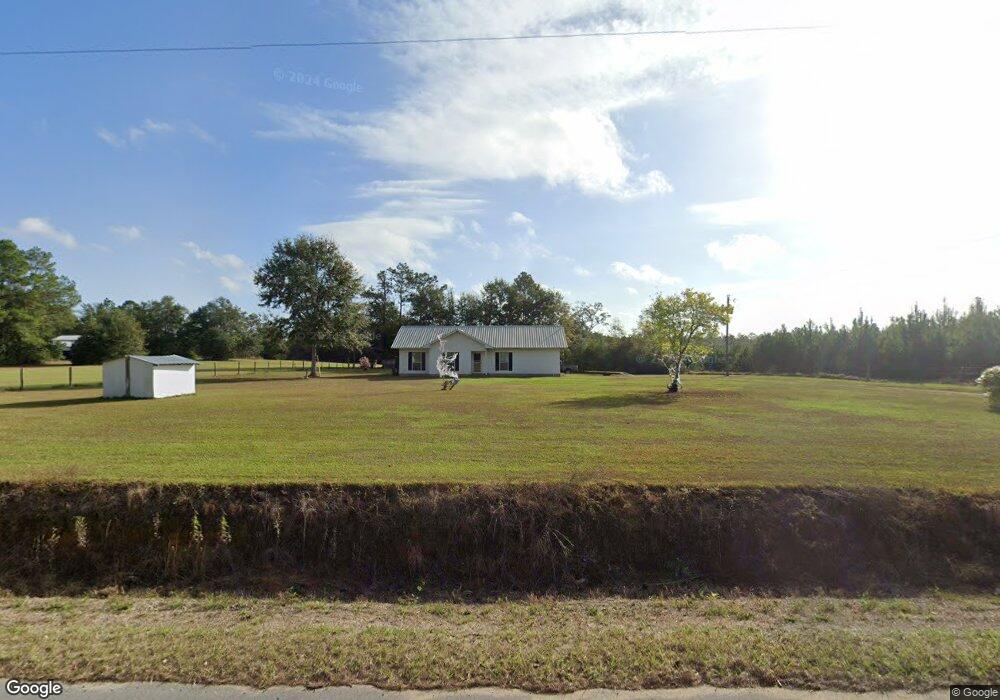
2021 Duncan Community Rd Chipley, FL 32428
Estimated Value: $174,000 - $229,000
3
Beds
1
Bath
1,024
Sq Ft
$190/Sq Ft
Est. Value
About This Home
This home is located at 2021 Duncan Community Rd, Chipley, FL 32428 and is currently estimated at $194,620, approximately $190 per square foot. 2021 Duncan Community Rd is a home located in Washington County with nearby schools including Kate M. Smith Elementary School, Vernon Elementary School, and Roulhac Middle School.
Ownership History
Date
Name
Owned For
Owner Type
Purchase Details
Closed on
Nov 5, 2021
Sold by
Larosa Ronald Luis and Larosa Sierra Yvonn
Bought by
Thompson Christopher and Thompson Harley
Current Estimated Value
Home Financials for this Owner
Home Financials are based on the most recent Mortgage that was taken out on this home.
Original Mortgage
$147,283
Outstanding Balance
$136,182
Interest Rate
2.88%
Mortgage Type
FHA
Estimated Equity
$58,438
Purchase Details
Closed on
Oct 24, 2011
Sold by
Richter Gregory M and Richter Angela L
Bought by
Larosa Rolando Luis and Forehand Sierra Yvonne
Home Financials for this Owner
Home Financials are based on the most recent Mortgage that was taken out on this home.
Original Mortgage
$84,693
Interest Rate
4.16%
Mortgage Type
New Conventional
Create a Home Valuation Report for This Property
The Home Valuation Report is an in-depth analysis detailing your home's value as well as a comparison with similar homes in the area
Home Values in the Area
Average Home Value in this Area
Purchase History
| Date | Buyer | Sale Price | Title Company |
|---|---|---|---|
| Thompson Christopher | $150,000 | Northwest Title Group Llc | |
| Larosa Rolando Luis | $80,000 | Dixie Abstract & Title Co In |
Source: Public Records
Mortgage History
| Date | Status | Borrower | Loan Amount |
|---|---|---|---|
| Open | Thompson Christopher | $6,787 | |
| Open | Thompson Christopher | $147,283 | |
| Previous Owner | Larosa Rolando Luis | $84,693 | |
| Previous Owner | Richter Gregory M | $65,200 |
Source: Public Records
Tax History Compared to Growth
Tax History
| Year | Tax Paid | Tax Assessment Tax Assessment Total Assessment is a certain percentage of the fair market value that is determined by local assessors to be the total taxable value of land and additions on the property. | Land | Improvement |
|---|---|---|---|---|
| 2024 | $1,171 | $127,784 | $6,500 | $121,284 |
| 2023 | $1,598 | $117,057 | $6,500 | $110,557 |
| 2022 | $1,469 | $106,784 | $6,200 | $100,584 |
| 2021 | $427 | $63,277 | $0 | $0 |
| 2020 | $426 | $62,403 | $0 | $0 |
| 2019 | $435 | $61,000 | $0 | $0 |
| 2018 | $444 | $59,863 | $5,200 | $54,663 |
| 2017 | $457 | $58,918 | $0 | $0 |
| 2016 | $459 | $57,706 | $0 | $0 |
| 2015 | $467 | $57,305 | $0 | $0 |
| 2014 | -- | $56,322 | $0 | $0 |
Source: Public Records
Map
Nearby Homes
- 1764 Clayton Rd
- O Lonnie Rd
- 0 Hwy 77 Unit 778039
- CABOT Plan at Kiersten Heights
- BEAUMONT Plan at Kiersten Heights
- 1767 Kenzie Ln
- 1416 Houston Rd
- 1509 Southern Way
- 1421 Gainer Rd
- 1268 Piney Grove Rd
- 1544 Highway 277
- 1465 Old Mill Rd
- XX1 Bonnett Pond Rd
- TBD 77
- XXX I-10 Hwy 77 Off Ramp
- TBD Tbd Blue Lake Rd
- 1310 Pine Bluff Ct
- 0 Meadowlark Ln
- XX1 Chance Rd
- lot 5 Byrd
- 2013 Duncan Community Rd
- 1987 Duncan Community Rd
- 1882 Clayton Rd
- 1918 Clayton Rd
- 1923 Duncan Community Rd
- 1980 Clayton Rd
- 1984 Clayton Rd
- 1905 Duncan Community Rd
- 1988 Clayton Rd
- 1833 Piney Grove Rd
- 1836 Piney Grove Rd
- 1811 Piney Grove Rd
- 1862 Duncan Community Rd
- 2022 Clayton Rd
- 1867 Larkin Dr
- 1850 Laster Rd
- 1756 Clayton Rd
- 1727 Houston Rd
- 1747 Clayton Rd
- 1750 Clayton Rd